|
|
||||||||||
| ARTICLES | TEAMS | STATS | RATINGS | STANDINGS | GAMES | SCHEDULE | PLAYERS | METHOD | SPORTS | |
Ranking College Conferences
By Michael Gertz
Friday, January 11, 2013
With the end of the 2012 college football season having arrived, it's time to see what our final team Ratings tell us about the relative power of the different college football conferences. The simplest way to judge the power of each conference is to take the average rating of teams within them. The difference between the ratings of 2 teams is essentially an expected point spread should they play at a neutral site. Here are those results for the past 2 seasons:
| 2011 Season | ||
|---|---|---|
| Rank | Conference | Avg Rating |
| 1 | Big 12 | 11.4 |
| 2 | SEC | 10.0 |
| 3 | Pac 12 | 7.9 |
| 4 | Big Ten | 4.4 |
| 5 | Big East | 3.3 |
| 6 | ACC | 0.3 |
| 7 | Mountain West | -6.9 |
| 8 | Conference USA | -7.2 |
| 9 | WAC | -7.9 |
| 10 | Mid-American | -8.3 |
| 11 | Sun Belt | -11.2 |
| 2012 Season | ||
|---|---|---|
| Rank | Conference | Avg Rating |
| 1 | SEC | 13.1 |
| 2 | Big 12 | 12.5 |
| 3 | Pac 12 | 6.9 |
| 4 | Big Ten | 2.8 |
| 5 | Big East | 1.3 |
| 6 | ACC | 0.9 |
| 7 | Sun Belt | -5.5 |
| 8 | Mountain West | -7.1 |
| 9 | WAC | -8.7 |
| 10 | Conference USA | -9.4 |
| 11 | Mid-American | -11.9 |
A couple of things stand out right away. The 6 AQ conferences clearly are significantly better than the others. And perhaps the assumption that the SEC is by far the best conference is a little overblown, considering that the average team in the Big 12 has been just as good as the average SEC team the past couple seasons. But maybe a simple average is not the best analysis. Let's delve deeper with complete graphs of the quality of teams in each conference, from best to worst, to get a better sense of which are the best "from top to bottom".
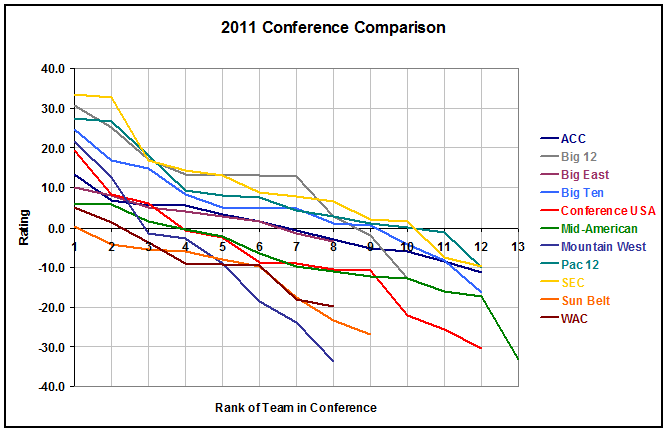
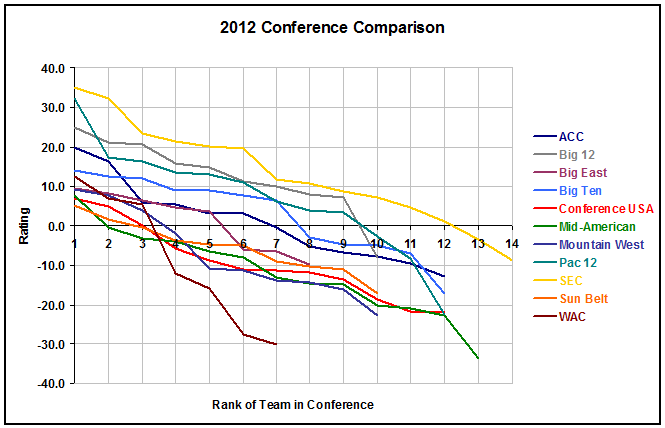
The big difference we see with this type of analysis is that a conference with more teams is forgiven for their worst teams. It is debatable as to which approach should be the standard, but certainly both have their merits. The simple average method could be argued to be the true test of depth of a conference, while the graphs comparing #1 vs #1, #2 vs #2, and so on seem more like the way we expect conference rankings to be formed. It could also be argued that the simple average method is better for comparing mediocre conferences, while matching up the top teams in each conference would be more appropriate for comparing the very best conferences.
Despite having the top 2 teams in the country in 2011, the SEC was not noticeably better than the Big 12 using either method. However, in 2012 the SEC was a bit better with either approach. Likewise, the Pac 12 and then Big Ten appear almost undebatable as #3 and #4 respectively in both years. The Big East and ACC are hard to compare because of the difference in number of teams. In 2011 the Big East clearly had the edge as the ACC looked like the Big East plus 4 bad teams. In 2012 the 2 conferences had similar averages, but it appears the edge has to go to the ACC due to the emergence of Florida State and Clemson.
The other 5 conferences are rather difficult to differentiate a whole lot. The main themes from average ratings are the Mountain West perhaps a step above the rest in general over the past 2 seasons, and the vast improvement of the Sun Belt from last in 2011 to 1st among non-AQs in 2012. A look at the graphs reveals the most unusual results are the bigger variation in quality within some western conferences. In 2011, Conference USA and the Mountain West proved to have quality teams at the top but terrible teams at the bottom as well. This trend was again apparent in the Mountain West in 2012, with the WAC displaying a similar pattern.
Impact of Recent Realignments
Interestingly, the Big 12 could easily be considered the strongest conference of the last 2 years if it did not happen to be getting the worst of recent realignments. Taking team memberships from 2011 and ratings from 2012, the Big 12 would have landed in 1st place in average rating yet again in 2012, by a whopping 14.6 to 12.0 margin over the SEC. The change was due to the transfer of Texas A&M from the Big 12 to the SEC, and the transfer of worse teams Texas Christian and West Virginia to the Big 12 from the Mountain West and Big East respectively (Missouri moving with A&M actually counteracted the shift in power a bit).
Other recent switches have had strong effects as well. The 2011 move of Colorado from the Big 12 to the Pac 12 has been a huge edge for the Big 12, while the corresponding move of Utah from the Mountain West to the Pac 12 has actually negatively affected the average rating of both conferences. As a result, the original Pac 10 teams would have averaged a 9.7 rating in 2011 and a 10.2 rating in 2012, putting the conference more in competition with the Big 12 and SEC. The Mountain West has actually inherited its 2 best and 2 worst teams from the WAC in the last 2 years, which has in turn replaced them with just 2 FCS schools.
Looking Ahead to 2013
Now that we've sorted out the current power structure of the conferences, let's take a look at how they will further evolve in the ever-changing landscape of conference alignment in college football. Below are all known expected conference changes for teams going into the 2013 season.
| Team | 2012 Rating | 2012 Conference | 2013 Conference |
|---|---|---|---|
| Maryland | -6.8 | ACC | Big Ten |
| Rutgers | 3.7 | Big East | Big Ten |
| Syracuse | 8.1 | Big East | ACC |
| Pittsburgh | 6.5 | Big East | ACC |
| San Diego State | 3.8 | Mountain West | Big East |
| Central Florida | 6.8 | Conference USA | Big East |
| Southern Methodist | 0.1 | Conference USA | Big East |
| Houston | -11.0 | Conference USA | Big East |
| Memphis | -13.6 | Conference USA | Big East |
| Utah State | 12.5 | WAC | Mountain West |
| San Jose State | 7.1 | WAC | Mountain West |
| North Texas | -9.1 | Sun Belt | Conference USA |
| Florida International | -11.0 | Sun Belt | Conference USA |
| Louisiana Tech | 5.3 | WAC | Conference USA |
| Texas-San Antonio | -15.9 | WAC | Conference USA |
| Texas State | -12.1 | WAC | Sun Belt |
| Georgia State | -- | FCS | Sun Belt |
| Texas-Arlington | -- | FCS | Sun Belt |
| Idaho | -27.7 | WAC | Independents |
| New Mexico State | -30.2 | WAC | Independents |
Clearly the monetary pecking order behind most moves is not quite in line with the quality of the teams and conferences involved (at least currently). With the disappearance of WAC football, here are the new conference rankings based on 2012 ratings of teams.
| 2013 Season | |||
|---|---|---|---|
| Rank | Conference | Avg Rating | Change |
| 1 | SEC | 13.1 | -- |
| 2 | Big 12 | 12.5 | -- |
| 3 | Pac 12 | 6.9 | -- |
| 4 | ACC | 2.5 | 1.6 |
| 5 | Big Ten | 2.2 | -0.6 |
| 6 | Big East | -2.2 | -3.5 |
| 7 | Mountain West | -5.0 | 2.1 |
| 8 | Sun Belt | -5.2 | 0.3 |
| 9 | Conference USA | -10.5 | -1.1 |
| 10 | Mid-American | -11.9 | -- |
While the top conferences remain the same without any realignment, the ACC leapfrogs the Big Ten and the Big East due to its acquisition of better teams, and the Mountain West jumps back above the Sun Belt by acquiring 2 of the stronger WAC teams. The Sun Belt rating is also an overestimation because it does not include the 2 unrated teams coming from the FCS. Interestingly, the further realignment threatens to make the recent fall from grace of the Big Ten a more permanent drop. If its historic powerhouses fail to rebound, its quality of football could actually drop below the ACC despite its clear edge in terms of desirability to schools.
| Recent Articles |
|---|
| If 2021 Had 16 Games - 1/10/22 |
| Wk 18 Playoff Scenarios 2021 - 1/8/22 |
| Wk 17 Playoff Scenarios 2020 - 1/1/21 |
| Wk 17 Playoff Scenarios 2019 - 12/27/19 |
| 2 Week Playoff Scenarios 2019 - 12/21/19 |
| 3 Week Playoff Tiebreakers 2019 - 12/11/19 |
| NFL Injury Point Value - 6/18/19 |
| How Teams Value Draft Picks - 4/25/19 |
| Analyzing The Zion Injury - 3/21/19 |
| Week 17 Playoff Scenarios 2018 - 12/27/18 |
| BUF | MIA | NE | NYJ | BAL | CIN | CLE | PIT | HOU | IND | JAC | TEN | DEN | KC | LV | LAC | |||||||||||||
| DAL | NYG | PHI | WAS | CHI | DET | GB | MIN | ATL | CAR | NO | TB | ARI | LAR | SF | SEA | |||||||||||||
| ProFootballLogic.com welcomes questions, requests, and error reports by email to contact@profootballlogic.com | ||||||||||||||||||||||||||||
| Privacy Policy | ||||||||||||||||||||||||||||
| Copyright © 2026 ProFootballLogic.com. All Rights Reserved. | ||||||||||||||||||||||||||||