|
|
||||||||||
| ARTICLES | TEAMS | STATS | RATINGS | STANDINGS | GAMES | SCHEDULE | PLAYERS | METHOD | SPORTS | |
Draft Position and Player Quality
By Michael Gertz
Thursday, April 25, 2013
Every NFL Draft is jam-packed with analysis of player quality and guesswork as to where players will be drafted. While it can be entertaining to watch the media speculate as to which players will have more success than others in the move to the professional level, in the end nothing is really a better predictor of rookie success than the actual number of draft pick that each player is selected with.
But while the media focuses on hazarding guesses about individuals, there are some general truths that can be gathered about draft classes as a whole which the media generally fails to address. With our extensive Player Ratings at ProFootballLogic, we can analyze not only how good a player can be expected to be based on their draft position, but also how likely it is that they will greatly exceed or fall short of expectations. Below is a graph of our current player rating for every player drafted in each of the last 4 draft classes, against their draft position. Players rated in the 70s are roughly backup quality, in the 80s are serviceable starter quality, and in the 90s are at an All-Pro level.
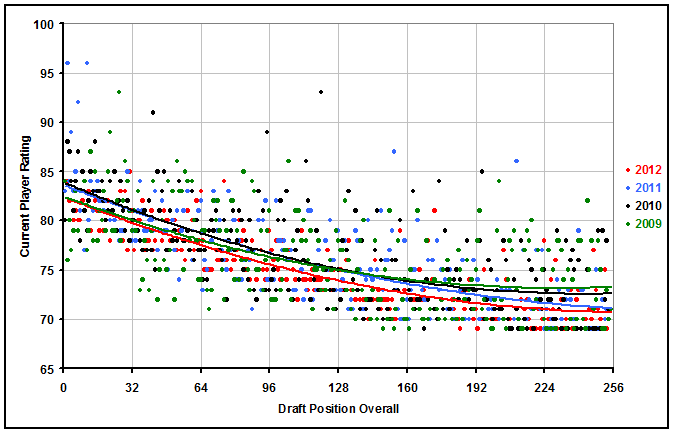
First, let's cover a few disclaimers. Obviously, no one group of NFL player ratings can be perfect. Individual players are much harder to analyze than teams as a whole, which is why our player ratings are the only part of the site that is not based purely on statistical analysis, but rather on a variety of quantitative and qualitative information. But here we are focusing more on league-wide trends than individual ratings, so individual discrepancies are not very significant. Another limiting factor is that player ratings are always to some extent influenced by draft position itself. This trend is clearly apparent by the fact that the older draft classes generally deviate more from the average curve, as those players have seen more game time and thus their true quality has in essence had more time to truly reveal itself (The average deviation from the trendlines ranges from about 1.6 for 2012 to 3.3 for 2009). Finally, though draft position has tick marks every 32 players, they do not quite align with the draft rounds after the first 3 rounds due to the addition of compensatory draft picks. And in those later rounds, trendlines from older years can be a bit biased upward because some players should deviate downwards below a 69 rating, but it is hard to tell who, because they are out of the league by that point.
Admittedly, there is nothing revolutionary about the general trendline we find, it is just about equal to what most people would expect. But a few aspects of the findings do deviate from general perceptions. First is the minimal player development over their first 4 years. By the end of their first 4 seasons, draft picks have generally already played out their rookie contracts, and have often reached near their full potential as a player, yet our average player rating for them is only about 2 points higher than when they were drafted. Misperceptions in player development are especially strong in 1st round picks. It is common to assume that 1st round picks are often either All-Pro's or busts, but in reality most will simply come into the league and remain as just serviceable starters, even in the top 10 picks.
Perhaps the most interesting aspect of this data is indeed the ability to precisely examine how likely players are to deviate from their draft position expectations. By their 4th season, the average player is about 3.3 points either better or worse than their expected rating. This number is somewhat consistent for all rounds, and gives us a great baseline for analyzing how likely a player is to be better than a player drafted below him. Below is a graph of how likely a player is to have a better rating after 4 years in the league compared to a player who was expected to be worse than him based on draft position. The bottom axis represents the difference in expected rating based purely on draft position.
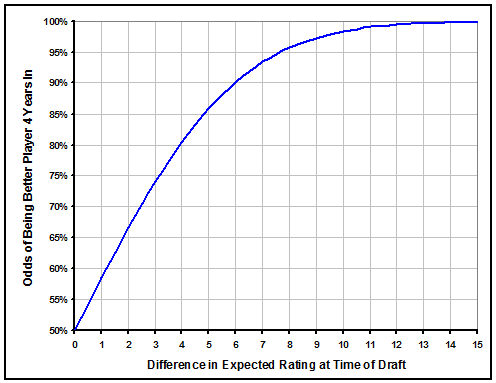
Using the two charts together, we can give the odds that any player drafted will be better than another after 4 years in the NFL. For instance, the 1st pick overall is expected to be about 3 points better than the 1st pick of the 2nd round, which corresponds to about a 74% chance of ending up the better player. Not quite as high as you might have assumed. But for players separated by more rounds, the odds do become almost a certainty. The 1st overall pick is expected to be about 10 points better than the 1st pick of the 5th round, with about a 98% chance of being the better player.
Keep in mind that there is a difference between a player's quality and their value to a team. Value to a team is generally an even more exponential curve because differences in quality are multiplied by the amount of playing time a player earns. Further, the value of a draft pick is not equivalent to the value a player provides to a team, because it depends on the salary of the player involved. So this analysis is better for evaluating expectations of player quality rather than trade value of draft picks. In the future, we will further examine some of these other topics such as salary cap analysis and the trade value of draft picks. But so far our other analyses have revealed this much: Players involved in the pass offense, and quarterbacks in particular, are underpaid. With that in mind, the main way that player quality differs from draft pick value is that any time an above average starting quarterback is drafted, it is much more impactful than when draft picks at other positions have success.
| Recent Articles |
|---|
| If 2021 Had 16 Games - 1/10/22 |
| Wk 18 Playoff Scenarios 2021 - 1/8/22 |
| Wk 17 Playoff Scenarios 2020 - 1/1/21 |
| Wk 17 Playoff Scenarios 2019 - 12/27/19 |
| 2 Week Playoff Scenarios 2019 - 12/21/19 |
| 3 Week Playoff Tiebreakers 2019 - 12/11/19 |
| NFL Injury Point Value - 6/18/19 |
| How Teams Value Draft Picks - 4/25/19 |
| Analyzing The Zion Injury - 3/21/19 |
| Week 17 Playoff Scenarios 2018 - 12/27/18 |
| BUF | MIA | NE | NYJ | BAL | CIN | CLE | PIT | HOU | IND | JAC | TEN | DEN | KC | LV | LAC | |||||||||||||
| DAL | NYG | PHI | WAS | CHI | DET | GB | MIN | ATL | CAR | NO | TB | ARI | LAR | SF | SEA | |||||||||||||
| ProFootballLogic.com welcomes questions, requests, and error reports by email to contact@profootballlogic.com | ||||||||||||||||||||||||||||
| Privacy Policy | ||||||||||||||||||||||||||||
| Copyright © 2026 ProFootballLogic.com. All Rights Reserved. | ||||||||||||||||||||||||||||