|
|
||||||||||
| ARTICLES | TEAMS | STATS | RATINGS | STANDINGS | GAMES | SCHEDULE | PLAYERS | METHOD | SPORTS | |
NFL Census 2016
By Michael Gertz
Wednesday, April 19, 2017
At ProFootballLogic, our extensive player database allows for a unique look at the set of NFL players along many demographic lines. In addition to categories like age and college that are on our Players page, we also track some things like race and in what state a player went to high school.
Age
Below is a graph of the number of NFL players that were each age on November 1st during the 2016 season. November 1st represents about the middle of the NFL season.

The most common age is 24, meaning the most common entry into the NFL is probably after a year or two of some combination of NFL practice squads and redshirting in college. After 24, players are more likely to exit the NFL than enter it, and each year become more likely to leave the NFL. One might assume that the amount of players was pretty consistent from age 24 to about 29 and then steeply dropped off, but in reality the drop out rate is considerable from the beginning, and only gradually increases over the years, as seen in the graph below.
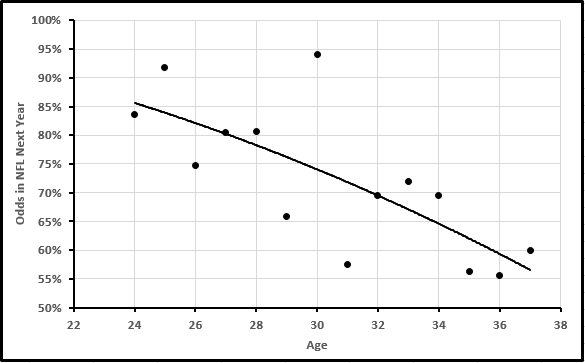
In reality, the graph is based on total numbers and doesn't technically represent the odds a player will last to the next season, because occasionally another player may enter the league at his same age to offset that, but it is close. The substantial drop out rate at young ages shows how many players are kept on rosters simply on potential and then are cut due to not improving rather than getting worse. The gradual change in slope also shows how much the NFL is a battle of attrition in avoiding injuries that greatly inhibit one's talent each year rather than always naturally declining at an older age.
An equivalent graph broken down by position is tough to clearly display due to the smaller sample sizes, but most positions do fall into very similar age distributions. Running backs do skew younger, but not to the extent many might expect. And they don't differ significantly from wide receivers and cornerbacks, which both also skew a bit younger than the other positions. On the other end, offensive lineman skew just a bit older than most positions, while quarterbacks, kickers, punters, and long snappers obviously routinely last until much older than all other positions.
Race
The racial data is based on an admittedly crude method of focusing on player photos, names, and public information, but still is able to categorize about 96% of players with a high degree of certainty. Classifications follow societal norms, in that many players very well may be of some degree of mixed race, but are simply classified as the most apparent race (typically not white). Any player that can't confidently be placed in any one race, or of whom photos are rare may end up in the other/unknown category (4% of players). Below is a table of all 2016 NFL players by race and position.
| NFL Racial Breakdown | |||||
|---|---|---|---|---|---|
| Position | Black | White | Pacific Islander | Other/Unknown | All |
| CB | 238 | 0 | 0 | 6 | 244 |
| DE | 162 | 31 | 1 | 7 | 201 |
| DT | 115 | 9 | 10 | 6 | 140 |
| FB | 11 | 17 | 3 | 2 | 33 |
| K | 0 | 35 | 1 | 1 | 37 |
| LB | 222 | 54 | 8 | 10 | 294 |
| LS | 0 | 36 | 0 | 1 | 37 |
| OL | 152 | 180 | 6 | 14 | 352 |
| P | 1 | 35 | 0 | 0 | 36 |
| QB | 18 | 77 | 1 | 2 | 98 |
| RB | 155 | 4 | 1 | 5 | 165 |
| S | 153 | 14 | 1 | 12 | 180 |
| TE | 58 | 68 | 2 | 12 | 140 |
| WR | 215 | 24 | 0 | 5 | 244 |
| All | 1500 | 584 | 34 | 83 | 2201 |
The NFL as a whole is about 68% black, although that number could be a couple percent higher from the unknowns. Black and pacific islander are hugely overrepresented compared to the American population, while all other races are heavily underrepresented. Of course, the racial breakdown also varies greatly by position.
We won't speculate too much about the cause of the racial differences, but it does appear that they are magnified at the positions that require the most athleticism relative to coordination, technique, or size. The main possible exceptions are that white players are more common at TE than LB, and more common at OL than DL. Some have suggested that such differences are based on coach bias. That may be true to an extent, especially if players are grooved into certain positions at a young age, but there are also different physical requirements from even those positions, such as the difference between offensive planned movements vs defensive reactionary movements.
It's nearly impossible to tell if any racial bias is present in general or at any position in the NFL, but there is one interesting case where it can be tested: between different teams. Obviously, different teams have different ratios of races among their rosters, but those differences do not imply bias unless their variation is more than what should be expected from random variation.
When team numbers of white players are compared to what would be expected from randomness if every player had the same odds of being white, the real numbers are very similar to the expected numbers. Unfortunately, a complete analysis of the expected numbers based on exact roster sizes and makeups by position is actually very complex. But it does appear that when broken down along such lines, some teams do favor white players a little more or less than others. However, much or even all of this difference could simply be due to different preferences in traits of players rather than race alone. Below is a racial roster breakdown by team.
| Race By Team | |||||
|---|---|---|---|---|---|
| Team | Black | White | Pacific Islander | Other/Unknown | All |
| ARI | 54 | 19 | 2 | 0 | 75 |
| ATL | 46 | 22 | 1 | 1 | 70 |
| BAL | 48 | 18 | 1 | 3 | 70 |
| BUF | 62 | 15 | 0 | 1 | 78 |
| CAR | 44 | 21 | 2 | 3 | 70 |
| CHI | 53 | 22 | 2 | 0 | 77 |
| CIN | 36 | 26 | 2 | 2 | 66 |
| CLE | 45 | 23 | 2 | 2 | 72 |
| DAL | 47 | 17 | 0 | 5 | 69 |
| DEN | 41 | 21 | 1 | 0 | 63 |
| DET | 46 | 20 | 1 | 1 | 68 |
| GB | 36 | 25 | 0 | 2 | 63 |
| HOU | 47 | 19 | 2 | 2 | 70 |
| IND | 50 | 16 | 0 | 2 | 68 |
| JAC | 48 | 18 | 1 | 3 | 70 |
| KC | 42 | 18 | 1 | 3 | 64 |
| LAC | 53 | 19 | 2 | 1 | 75 |
| LAR | 46 | 19 | 0 | 1 | 66 |
| MIA | 52 | 17 | 1 | 1 | 71 |
| MIN | 38 | 25 | 1 | 2 | 66 |
| NE | 38 | 20 | 0 | 2 | 60 |
| NO | 46 | 20 | 3 | 6 | 75 |
| NYG | 55 | 13 | 1 | 0 | 69 |
| NYJ | 56 | 16 | 0 | 0 | 72 |
| OAK | 51 | 9 | 0 | 2 | 62 |
| PHI | 38 | 18 | 3 | 3 | 62 |
| PIT | 48 | 14 | 0 | 2 | 64 |
| SEA | 54 | 13 | 2 | 1 | 70 |
| SF | 52 | 19 | 0 | 2 | 73 |
| TB | 50 | 17 | 1 | 1 | 69 |
| TEN | 46 | 16 | 1 | 1 | 64 |
| WAS | 49 | 16 | 2 | 0 | 67 |
Home Town
To see where NFL players come from, let's look at the states in which they went to high school.
| NFL Players by State of High School | |
|---|---|
| State | Players |
| Florida | 253 |
| California | 241 |
| Texas | 231 |
| Georgia | 148 |
| Ohio | 101 |
Florida, California, and Texas rightly have the reputation of being the major pipelines, as together they account for 34% of all NFL players. But the total population of states has a huge impact on the numbers, so let's see which have the highest rate of NFL players per million residents.
| NFL Players per Million Residents | |
|---|---|
| State | Players |
| D.C. | 20.6 |
| Louisiana | 15.2 |
| Alabama | 15.1 |
| Georgia | 14.9 |
| Florida | 13.1 |
If you read the race section above, it shouldn't come as a surprise that the states contributing the most NFL talent per population are essentially just those that are the blackest. 68% of the NFL being black may not seem that lobsided, but only 13% of Americans are black. In fact, when you run the numbers, blacks are actually 13 times more likely to be in the NFL than whites.
So which states produce NFL players at the highest rate if you account for race? Below is a map of the ratio of NFL players from each state relative to what would be expected based off the state's racial makeup and the relative NFL rate of blacks and whites (other races aren't counted in either the NFL number or the expected number). Blue is under 0.6, then green, then cutoffs for yellow, orange, and red respectively at over 0.8, 1.25, and 1.67.
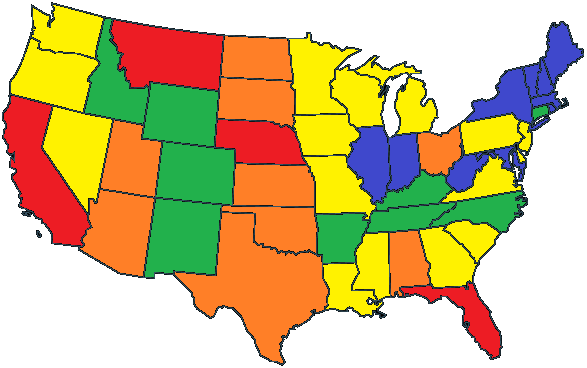
D.C. would be yellow, and Alaska and Hawaii would both be blue. Alaska and Vermont are the only states where no 2016 NFL players went to high school. Hawaii would only be blue because it's black and white population isn't well represented in the NFL. It still produces NFL players at an above average rate, but most are pacific islander.
California and Florida do churn out a high rate of NFL players even adjusting for population and racial demographics, and Texas isn't far behind. Other states with strong football reputations like Ohio and the center of the country also show well, while the northeast lags behind. One surprising result is the two clear swaths of green states surrounded by others with more production, with no clear reason why they particularly struggle to produce talent.
Interestingly, while a few states like Texas, California, Kansas, and Arizona have above average rates for both blacks and whites, and most of the blue and green states are below average for both races, many states greatly differ in their success depending on race. In the southeast, blacks make the NFL at even higher rates, but whites only do at a bit below the average white rate. While in most of the other generally productive states outside the southeast not already listed above, the higher rate is among whites, and blacks actually make the NFL at a lower rate than the black average.
The varying rates for blacks could possibly be explained by the fact that more rural environments in the southeast are more conducive to football than dense cities elsewhere, whereas the urban/rural balance is more even for whites among regions of the country. The variations among white NFL rates is more spotty and hard to explain, perhaps mostly a function of simply where high school football is a bigger part of the culture.
Colleges
Now that we know where NFL talent is concentrated in high school, we can investigate how that talent flows through colleges. For this, we can ignore population and race, and simply look at how many NFL players went to college in a state compared to the number that went to high school there. The map below shows the ratio of college players to high school players for each state. Here, blue is under 0.5, then green, then yellow, orange, and red at above 0.75, 1.33, and 2.0 respectively.
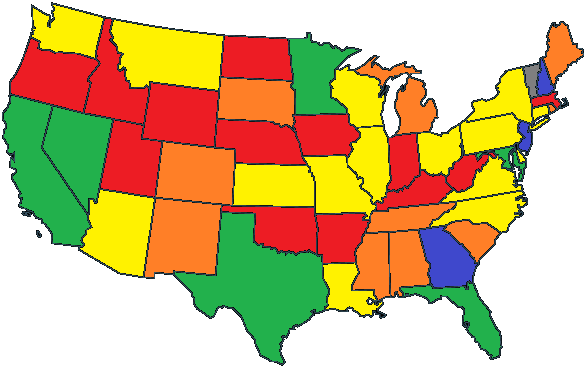
In this map, Vermont is gray as it had no high school or college players. Alaska would also be gray. And like high school, they are the only two states where no 2016 NFL player went to college. D.C. and Hawaii would both be blue. And like the high school map, the 5 or 10 least populated states have too small a sample size for reliable data.
The map is kind of like a recruiting gauge, showing which states's colleges manage to recruit NFL caliber talent from outside, and which get their home grown talent recruited away. However, the bigger trend seems to simply be that players go from more populated states to less populated ones, presumably because many states simply have about 2 public universities with FBS football programs regardless of the population of the state. Much of the trend probably has to due with competition from NFL markets in large cities in the more populated states, but other intricacies probably exist.
For a full list of how many current NFL players went to each college, as well as a list of the players, visit our Players By College page. The top 10 schools for NFL players on 2016 rosters are listed below.
| NFL Players by College | ||
|---|---|---|
| Conference | College | Players |
| SEC | LSU | 49 |
| SEC | Florida | 45 |
| ACC | Florida State | 44 |
| ACC | Miami (Fla.) | 43 |
| Big Ten | Ohio State | 43 |
| Pac 12 | USC | 42 |
| SEC | Alabama | 42 |
| SEC | Georgia | 41 |
| SEC | Auburn | 37 |
| ACC | Clemson | 36 |
Interestingly, 9 of the 10 teams above have won 15 of the last 16 national championships, with the exceptions being a championship for Texas and none for Georgia. The table below totals all the 2016 NFL players who went to college in each FBS conference.
| NFL Players by Conference | |
|---|---|
| Conference | Players |
| SEC | 401 |
| Big Ten | 301 |
| ACC | 291 |
| Pac 12 | 276 |
| Big 12 | 164 |
| American Athletic | 123 |
| Mountain West | 93 |
| Conference USA | 83 |
| Mid-American | 61 |
| Sun Belt | 52 |
| Independent | 51 |
No non-FBS conference has as many NFL alums as any FBS conference, but some FCS and even D-II conferences aren't too dramatically less. Finally, below is a list of which divisions 2016 NFL players went to college in.
| NFL Players by Division | |
|---|---|
| Division | Players |
| D-I FBS | 1896 |
| D-I FCS | 185 |
| D-II | 90 |
| D-III | 14 |
| U SPORTS | 6 |
| NAIA | 5 |
| None | 4 |
86% of 2016 NFL players came from FBS programs, and 99% come from D-II or above. But some may be surprised to find that D-II produces about half as many NFL players as FCS does. U SPORTS is like the NCAA for Canadian universities, and the NAIA is an organization of non-NCAA colleges. Players with no division are typically tight ends who played basketball in college at a school that didn't have a football program, but can include schools that no longer have football programs, or other foreign players.
| Recent Articles |
|---|
| If 2021 Had 16 Games - 1/10/22 |
| Wk 18 Playoff Scenarios 2021 - 1/8/22 |
| Wk 17 Playoff Scenarios 2020 - 1/1/21 |
| Wk 17 Playoff Scenarios 2019 - 12/27/19 |
| 2 Week Playoff Scenarios 2019 - 12/21/19 |
| 3 Week Playoff Tiebreakers 2019 - 12/11/19 |
| NFL Injury Point Value - 6/18/19 |
| How Teams Value Draft Picks - 4/25/19 |
| Analyzing The Zion Injury - 3/21/19 |
| Week 17 Playoff Scenarios 2018 - 12/27/18 |
| BUF | MIA | NE | NYJ | BAL | CIN | CLE | PIT | HOU | IND | JAC | TEN | DEN | KC | LV | LAC | |||||||||||||
| DAL | NYG | PHI | WAS | CHI | DET | GB | MIN | ATL | CAR | NO | TB | ARI | LAR | SF | SEA | |||||||||||||
| ProFootballLogic.com welcomes questions, requests, and error reports by email to contact@profootballlogic.com | ||||||||||||||||||||||||||||
| Privacy Policy | ||||||||||||||||||||||||||||
| Copyright © 2026 ProFootballLogic.com. All Rights Reserved. | ||||||||||||||||||||||||||||