|
|
||||||||||
| ARTICLES | TEAMS | STATS | RATINGS | STANDINGS | GAMES | SCHEDULE | PLAYERS | METHOD | SPORTS | |
How College Basketball Rankings Fail
By Michael Gertz
Friday, February 28, 2014
Here at ProFootballLogic, our College Basketball ratings are not perfect, but when you track them over the long run they are a lot better than the most well known rankings such as AP and Coaches Polls, RPI, and NCAA Tournament selection committee decisions. Even without long term tracking, it is clear that our ratings line up more closely with betting markets on a daily basis. Ours aren't the only more sophisticated ratings that are consistently better than the most well known rankings. Others such as KenPom, adjusted scoring margin, and ESPN's BPI are all also more accurate to varying degrees. But for simplicity, we'll use our ratings below to answer the following key questions: Why do the popular rankings fail? And which teams this season are they failing on the most?
How to Form Logical Ratings
The most common rankings have 2 valid excuses. Part of their purpose is to judge how successful teams have been and reward that, rather than predict future performance. And they also incentivize teams to win games rather than simply maximize point differential. But most people incorrectly view the rankings and actual team quality as one in the same. The 2 excuses are more valid in college football, where teams are rewarded with bowl games based on rankings, although voters do admit that they factor in point differentials. But in basketball, the NCAA tournament selection committee openly admits that their goal is to pick the best teams, not just the most successful.
When we rate teams, everyone tries to use the same logic: how well has each team played compared to how difficult their schedule has been. But sadly for most, including those voting in polls and selecting tournament teams, this usually boils down to a quick glance at a team's results, with an overemphasis on a team's overall record and a few key games they remember or watched. While a better method like ours may require a few calculations, it is not as complex or impossible as many may think.
Our method is actually rather simple. If everyone agrees that what matters is how well a team plays and how difficult their schedule has been, then let's just make a graph for each team where the axes are exactly those 2 quantities. Below is that graph for the current #1 team in the AP Poll, Florida. Each data point on the graph represents a game the team in question played. The vertical axis is the point differential of each game, with positive meaning they won by that many points. The horizontal axis is how difficult each game was (with home-field advantage factored in). The scale is relative to what result you would expect the average D-I team to have against that opponent in that location. For example, a value of 10 on the horizontal axis means that game is 10 points more difficult than the average opponent, or that the average D-I team would lose to that opponent at that location by 10 points on average.
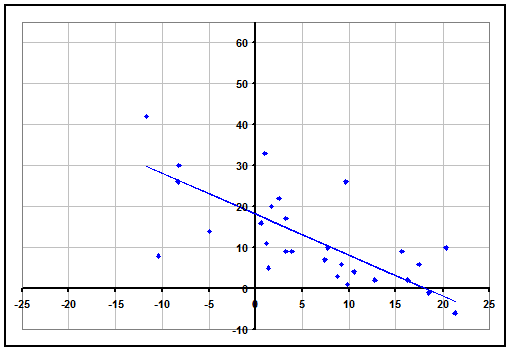
Now all we have to do is assign a best-fit line to the data, with one small caveat. The line must intersect both axes at the same value (a team that we expect to beat the average team by 12 points will on average essentially tie another team that we also expect to beat the average team by 12 points). And the line is straight rather than curved because our team ratings are additive. If we expect team A to beat team B by 5 points, and expect team B to beat team C by 10 points, then we expect team A to beat team C by 15 points. This concept may not be 100% true for every single team (some teams may pile on points in a lopsided victory more than others), but in general it holds true and is the most accurate assumption to make. For instance, if you track betting lines, you will find the same additive property we described.
Then to come up with a team rating, all we have to do is take the value at which the line intersects the axes (our rating for Florida is about 18). The average D-I team will have a rating of 0, and the difference between 2 teams' ratings (plus or minus home-field advantage) will equal an estimated spread for a game between them. Of course to generate our ratings in the first place, we must optimize all team ratings at the same time to know where to place the data points on the horizontal axis in the first place. But after that, we can simply look at graphs of teams to see why their ratings are what they are. We can also use the graphs to see why sometimes the common rankings of teams are inaccurate. Below we analyze the 3 most common ways.
The Recency Effect
It is well known in psychology that people are biased in how they remember things. We are more prone to remember the very beginning and end of a series of information rather than the middle. In sports, the season is so long that we usually remember the most recent games and the beginning bias fades away. Sadly, this effect is not only subconscious but conscious as well, as analysts have incorrectly determined that recent information is more valuable than older information. Occasionally it can be, if injuries are present, but overwhelmingly the order of a season's results are unimportant with how well prepared teams come into the season and how randomly timed injuries are.
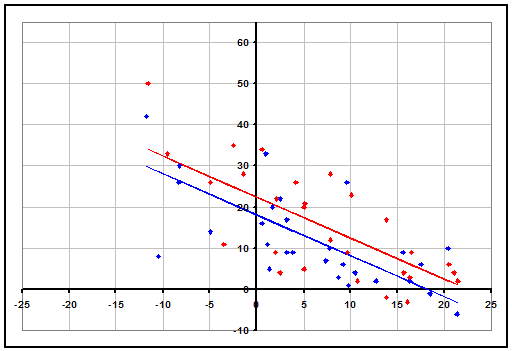
The recency effect is usually one of the smaller biases of common rankings, but at the moment it appears to be very large at the top of the rankings. AP #1 Florida and #3 Arizona are both 26-2, have faced a similar level of difficulty in their schedule (if anything Arizona has played the tougher schedule), yet Florida is being deemed the #1 team by a 47-4 margin in the AP and 24-0 margin in the Coaches Poll. With Arizona also being ahead in standard methods of strength of schedule, adjusted scoring margin, and RPI, the only reason to give Florida the edge seems to be a bias for recent games. Below, we have plotted Arizona's games (in red) on top of Florida's graph from above, showing that Arizona has won their games by more points, and accounting for the difficulty of schedule, have actually had results that are over 4 points better per game, indicating a 66% chance that they would win a head-to-head matchup.
Strength of Schedule Errors
On average, the common polls do a decent job of estimating the relative difficulty of different conferences, and don't systematically overvalue or undervalue teams from weaker conferences. But there are a few specific cases where strength of schedule can trip up the polls in a major way. Because the rankers often fall back on overall record, a conference with several very good teams at the top like the Big Ten can get underrated. As the big teams all do damage to each other's records while all facing extremely tough schedules, rankers fail to fully account for the difficulty of their schedules.
The flip side to this is a weak conference without much competition at the top. Teams from bad conferences usually get ranked appropriately if the entire conference is bad, or if there are a few good teams at the top that occasionally beat each other. But when a single good team like AP #2 Wichita State is in a conference without any other good teams, they can get mislabeled as a great team because they can easily put up a gawdy record. Teams like this will often get overrated for a while, and then get docked tremendously once they finally do lose, because the rankers have no idea where to put them.
The much more reliable way to rate teams like this is to consider their margins of victory, which our ratings do. If a team with weak competition is blowing out their opponents (like Florida State in football), they usually are deserving of a high rating, but if they aren't, they are probably going to be overrated. Below is our graph for Wichita State.
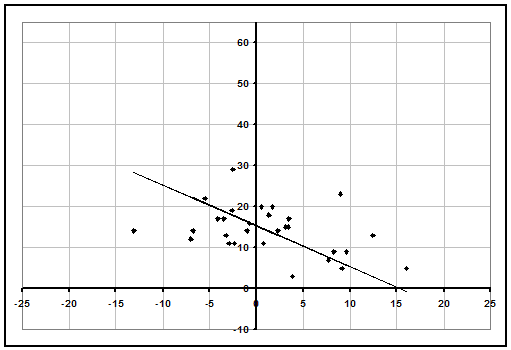
We can clearly see that their record is just a result of only playing easy opponents, and they are not winning by large enough margins to justify a great rating. Teams in strong conferences have often played 8-10 games as difficult as Wichita State's toughest. Our rating for Wichita State is 15.4, only 21st best in the country.
But maybe Wichita is getting a bad rap because they blow out their opponents early on, and then ease up late in the game so their scoring margins aren't as large. Actually, when we look closer, we see that isn't the case. In fact, Wichita State was trailing at halftime in 8 of their games. They aren't easing up in blowouts, they simply aren't winning by very much because they aren't that good.
Clutch/Luck Confusion
More often than the above 2 reasons, the most common way for a team to be inaccurately ranked by polls is for them to simply have been very lucky or unlucky. This usually occurs in the form of having your best performances during the games where you actually needed them. Losing two games by 1 point each is much more impressive than winning one by 1 and losing the other by 20, but point differentials usually get lost in the mix for poll voters. Time and time again, stuides have shown that teams that have a poor record in close games generally see improved records thereafter, and vice versa. Essentially, what are commonly referred to as clutch performances are actually many more parts simply good luck.
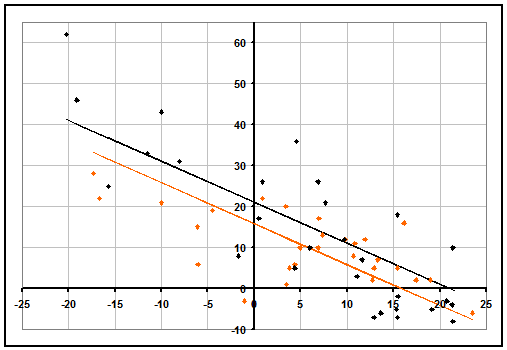
When comparing teams that are all good, luck favors those who had their better games against their tougher competition, and hurts those who happened to have their better games against opponents they could have beaten even while playing poorly. This dichotomy can be clearly seen when looking at performance graphs of AP #4 Syracuse (in orange) and #20 Iowa (in black) below. On top of facing many more difficult opponents, Iowa has clearly outperformed Syracuse against easy competition, but has fared worse against their tough opponents. Although Iowa's rating will likely drop from 21 to about 20 based on this week's games, as a whole their best-fit line will remain over 4 points better than Syracuse.
Current AP Failures
Because our ratings are more accurate than the AP rankings, teams' AP rankings generally tend more toward our ratings rather than ours move toward them over the course of the season. Since our first ratings of the season 4 weeks ago, teams that we had in the top 6 all along like Duke and Creighton have jumped from 17th to 6th and 20th to 9th respectively in the AP Poll. There are always a few counterexamples like Iowa State, where our rating has tended toward the AP ranking, but in general the trend is clearly the other way. With that in mind, let's take a look at where our ratings currently differ the most from the latest AP Poll and where it is likely to be failing due to some of the aforementioned reasons.
| Teams the AP Poll is Misjudging | |||
|---|---|---|---|
| Team | AP | Our Rating | Reason |
| Florida | #1 | #12 (18.1) | Recency & Luck |
| Wichita State | #2 | #21 (15.4) | Schedule & Luck |
| Syracuse | #4 | #19 (15.8) | Luck & Schedule |
| Louisville | #7 | #2 (22.3) | Luck |
| St. Louis | #10 | #33 (13.1) | Luck & Schedule |
| Cincinnati | #11 | #23 (14.4) | Luck |
| San Diego State | #13 | #26 (13.4) | Luck & Schedule |
| Michigan State | #18 | #8 (18.5) | Schedule |
| Iowa | #20 | #3 (21.0) | Luck & Schedule |
| Memphis | #21 | #36 (12.7) | Schedule & Luck |
| Ohio State | #22 | #10 (18.4) | Schedule |
| Texas | #24 | #40 (12.5) | Luck |
| New Mexico | #25 | #44 (11.8) | Schedule & Luck |
| Recent Articles |
|---|
| If 2021 Had 16 Games - 1/10/22 |
| Wk 18 Playoff Scenarios 2021 - 1/8/22 |
| Wk 17 Playoff Scenarios 2020 - 1/1/21 |
| Wk 17 Playoff Scenarios 2019 - 12/27/19 |
| 2 Week Playoff Scenarios 2019 - 12/21/19 |
| 3 Week Playoff Tiebreakers 2019 - 12/11/19 |
| NFL Injury Point Value - 6/18/19 |
| How Teams Value Draft Picks - 4/25/19 |
| Analyzing The Zion Injury - 3/21/19 |
| Week 17 Playoff Scenarios 2018 - 12/27/18 |
| BUF | MIA | NE | NYJ | BAL | CIN | CLE | PIT | HOU | IND | JAC | TEN | DEN | KC | LV | LAC | |||||||||||||
| DAL | NYG | PHI | WAS | CHI | DET | GB | MIN | ATL | CAR | NO | TB | ARI | LAR | SF | SEA | |||||||||||||
| ProFootballLogic.com welcomes questions, requests, and error reports by email to contact@profootballlogic.com | ||||||||||||||||||||||||||||
| Privacy Policy | ||||||||||||||||||||||||||||
| Copyright © 2026 ProFootballLogic.com. All Rights Reserved. | ||||||||||||||||||||||||||||