|
|
||||||||||
| ARTICLES | TEAMS | STATS | RATINGS | STANDINGS | GAMES | SCHEDULE | PLAYERS | METHOD | SPORTS | |
Do NCAA Basketball Teams Get Hot?
By Michael Gertz
Wednesday, March 15, 2017
Every year we hear it when March Madness roles around: "I'm picking them, they're hot!". And not just from fans, but from analysts, and even coaches and players. So there must be something to it right? But when does a coincidence turn into a hot streak?
What Does it Look Like?
There's no doubt that many teams have more or less success toward the end of the season than they did at the beginning of the season. Using our season total Team Ratings as a baseline, and accounting for the opponent and location of each game, we calculated every team's success over the course of the 2015-16 season. Every game was given a rating in terms of the final score difference minus the expected final score difference. For instance, if a team is 3 points better than another, and is at home, they can be expected to win by about 6 points. If they end up winning by just 3, their point differential above expected in that game would be -3.
After tracking these results for every game, the average team shows a trend up or down over the course of the season by about 0.2 points per game, or about 6 points over the course of about a 30 game season. Of course some teams show no trend while others show more, but that is the average absolute value of the slope. For an example of a team that really improved over the season, below is this graph for Tennessee, which showed a trend about twice as strong as average.
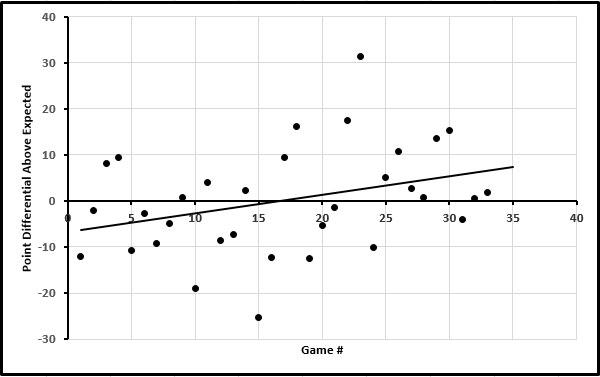
It's hard to look at the graph and say Tennessee didn't get better. Their season total rating was 6.8 points above average, meaning the y-axis mark at 0 represents a result to be expected from a team that would beat the average team by 7 points, anything above that is better and below that is worse.
Following the trendline, they started the season with results indicative of a team that's only about average in all of D-I, or about 176th best of the 352 teams. However, they finished the season with results typical of a team that is about 14 points better than average, or about 30th best, and easily worthy of an at-large bid in the NCAA Tournament. Had they played every game against an opponent of equal caliber to their season average on a neutral court, they easily could have started the season 2-6 but finished it on a 8-1 run.
How Do We Know When We See It?
There's just one problem with the graph above. It does represent the results of Tennessee's season, but we randomized the order of their games. That means what we're looking at is random variation, and not an actual trend of improvement over the course of the season showing that they may be worthy of making the tournament despite a less than stellar start to the season. In fact, we randomized the order of every team's games from that season. And the problem is there are just as many fake random "hot" or "cold" teams to find in that data as there are in the real data.
The average team shows a trend with their games randomized that is just as strong as with their games in their actual order. The average trend for all teams is 0.199 points up or down per game compared to 0.195 for the real order. That means virtually all the trends we find in a team's results over a whole season are just random variations that people are interpreting as causation.
What About Other Time Frames?
We also tried a slightly different approach than the original one. In this analysis, we took the trend from a team's first 20 games, and then looked at how teams did in any games after those first 20, depending on their trend from the first 20. This 20 game cutoff is more similar to the pre-tournament cutoff, just with a larger sample size. Again, we found that regardless of a team's trend in the first 20, their average results in any further games were best predicted by the average of all their results from the first 20 games.
But what if teams only get hot or cold for like 5 games here or there at a time, so the streaks don't show up on the season long analysis above? For one, any such streaks should increase the average trends in the analysis above so long as they don't occur in the middle of the season. Another problem with analyzing such a scenario is that it requires teams to bounce back to the average (or even further to the average prior to the streak) right when they appear the hottest or coldest. Unless the length of the streak is the same each time, which seems doubtful, it would be very difficult to ever predict that a streak would continue rather than end.
Is the Theory of Hot Teams Busted?
We have demonstrated that in general a team that has been better later in the season is no more likely to outperform their season average than a team that has been worse later in the season. This probably busts the majority of times someone on TV says a team is hot or cold. It also means that our team ratings would only be made worse by adding more importance to more recent games.
However, common sense tells us that streaks are not entirely mythical. Obviously, if a key player on a team is injured, the team's quality will be altered for a specific amount of time, which is equivalent to a streak that could be detected by our analysis as long as it didn't occur right in the middle of the season. But such injuries simply aren't common or impactful enough in college basketball to show a significant effect among the rest of the games as a whole. There still may also be other small trends in team quality due to player development, cohesion, or coaching, but they probably don't play a large role in college basketball. The same goes for the potential that the prophecy of a streak could become self-fulfilling if officials buy into it.
Other models for other sports or leagues have had some success is assigning greater importance to more recent games. That makes sense in leagues where certain individual players have a larger impact, injuries are more common, or seasons are longer, but in college basketball it does not appear to be the case. Of course, if there is a legitimate reason behind a suspected hot or cold streak, like an injury or change in strategy, there may be something to it. But if the suspicion is simply based on game outcomes, it is likely to be unfounded.
| Recent Articles |
|---|
| If 2021 Had 16 Games - 1/10/22 |
| Wk 18 Playoff Scenarios 2021 - 1/8/22 |
| Wk 17 Playoff Scenarios 2020 - 1/1/21 |
| Wk 17 Playoff Scenarios 2019 - 12/27/19 |
| 2 Week Playoff Scenarios 2019 - 12/21/19 |
| 3 Week Playoff Tiebreakers 2019 - 12/11/19 |
| NFL Injury Point Value - 6/18/19 |
| How Teams Value Draft Picks - 4/25/19 |
| Analyzing The Zion Injury - 3/21/19 |
| Week 17 Playoff Scenarios 2018 - 12/27/18 |
| BUF | MIA | NE | NYJ | BAL | CIN | CLE | PIT | HOU | IND | JAC | TEN | DEN | KC | LV | LAC | |||||||||||||
| DAL | NYG | PHI | WAS | CHI | DET | GB | MIN | ATL | CAR | NO | TB | ARI | LAR | SF | SEA | |||||||||||||
| ProFootballLogic.com welcomes questions, requests, and error reports by email to contact@profootballlogic.com | ||||||||||||||||||||||||||||
| Privacy Policy | ||||||||||||||||||||||||||||
| Copyright © 2026 ProFootballLogic.com. All Rights Reserved. | ||||||||||||||||||||||||||||