|
|
||||||||||
| ARTICLES | TEAMS | STATS | RATINGS | STANDINGS | GAMES | SCHEDULE | PLAYERS | METHOD | SPORTS | |
Analyzing The Zion Injury
By Michael Gertz
Thursday, March 21, 2019
Our NCAA Basketball team ratings are pretty sophisticated. They optimize every team's rating as well as an overall amount of home court advantage and game variability at the same time based on the entire season's game results, all the while factoring in past years' team ratings, recruiting ratings, and players lost to the NBA draft to the extent that they are predictive. However, one thing they don't account for is the subjective nature of how important injuries to individual players are.
Typically, this doesn't significantly affect the ratings of many tournament teams, as very few teams have significant injuries to impact players in such a way that their availability is different from the regular season to the tournament. But this year, perhaps the best player in the country, playing on perhaps the best team in the country, missed some time, and his team played worse during his absence. Because of this, and because small changes to the ratings of the best teams can greatly affect championship odds, let's delve into how the injury to Zion Williamson may affect our team rating for Duke.
The Base Numbers
An advantage to having functional predictive team ratings for every team like our model produces is that we can assign a value to how well a team played in every game, based off their opponent's strength and the location of the game. Because of this, we can analyze how well Duke played with and without Zion, without having to resort to massively flawed metrics like overall W-L record or even point differential.
The graph below shows how well Duke played in each game compared to what would be expected from a D-I average team. For instance, Game 2 is against Army at home. Army is rated 6 points below average. Adding home court advantage, an average team should win that game by 9. Duke won it by 22, meaning they played 13 net points better than an average team. The 6 red dots from Game 26 to 31 represent the games that Zion missed due to injury.
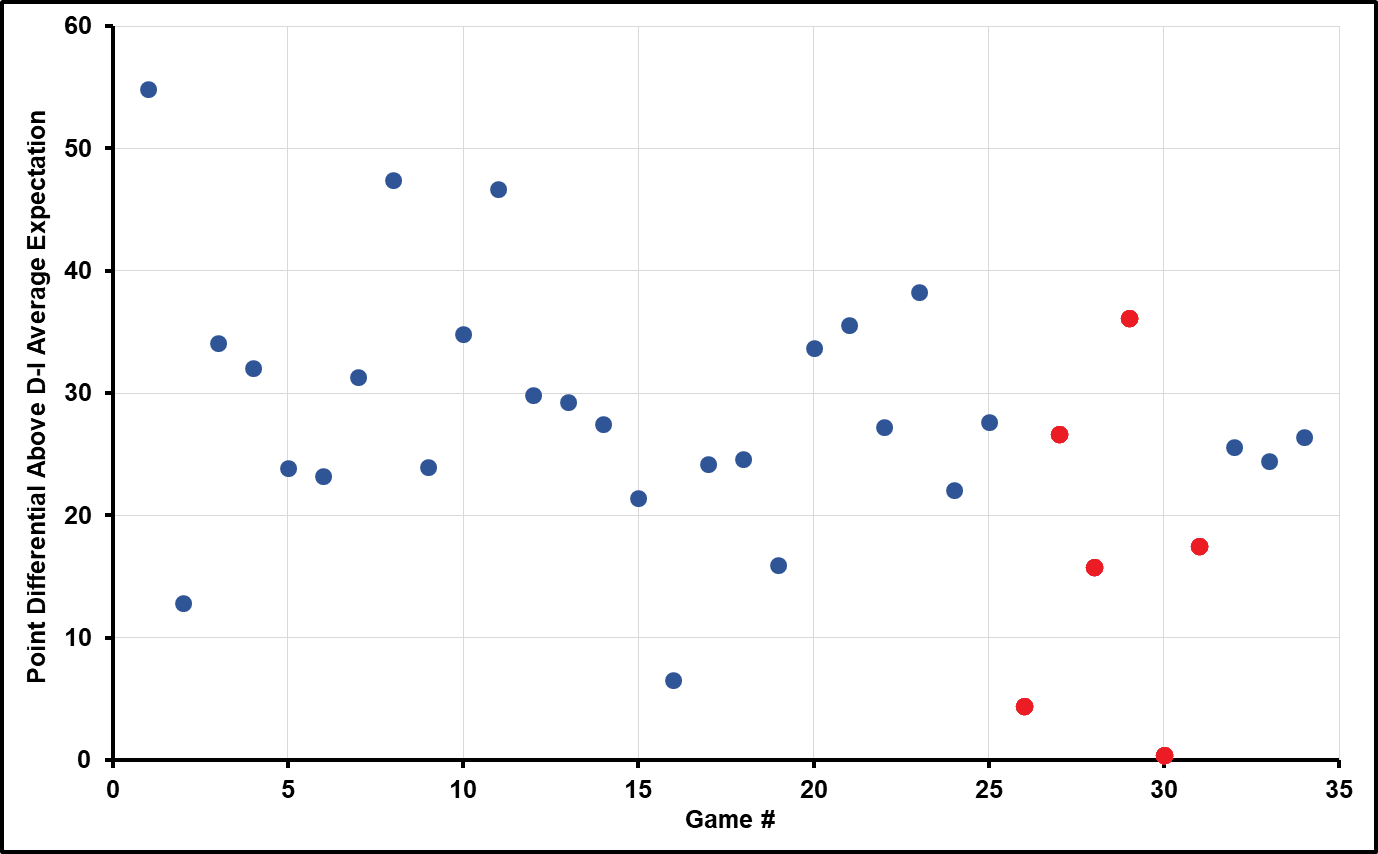
What we find is that after accounting for opponents and locations, Duke performed at a level 26.6 net points per game better than an average D-I team for the season as a whole. Due to our model's Bayesian style method of quantifying the amount of randomness involved, and the fact that it projected a team rating for Duke of just 20.2 coming into the season, our final team rating for Duke was 25.5, essentially estimating that they likely outperformed their true quality by about 1.1 net points per game. (This 1.1 is not too controversial, as it functions in a similar manner for most other top teams, so its relative influence is minor).
But breaking down the 26.6 figure, Duke performed at a 28.8 level in their 28 games with Zion Williamson, and just a 16.8 level in the 6 games without him (counting the game he was injured in the first minute). Therefore, Duke performed 2.2 (28.8-26.6) net points per game better with Zion than their season total figure. If we ignored the small sample size (and assumed Zion will stay healthy throughout the tournament), this difference could be added to our rating for Duke, implying a team rating more like 27.7 rather than our standard 25.5 value.
Accounting for the Small Sample
However, we can probably do better than ignoring the small sample size of just 6 games that Zion missed, because there is additional information we can consider. Most notably, we can question the underlying assumptions that we would make if we did ignore the small sample size. By ignoring the small sample size, we are essentially estimating that Zion is worth 12.0 net points per game to Duke. And that without him, Duke would be the 15th best team, worthy of only about a 4 seed. But these 2 figures both seem rather extreme in the larger context.
For one, 12 net points would be an extremely large figure for any basketball player. Most betting or analytical models probably wouldn't value many players at even half that amount. It's so large that it would imply trading Zion from Duke to a typical 13 or 14 seed would make a game between the 2 a tossup. Additionally, most analysts would likely consider Duke to be better than a 4 seed even without Zion. This is consistent with the bookmaker point spreads during Zion's absence. Over this span, the point spreads typically didn't vary from what would be expected by our 25.5 rating for Duke by over 4 points, corresponding to Duke still being a top 8 quality team without Zion.
Considering all this, it appears that at least half of Duke's struggles without Zion could very well have been random variation rather than an actual lack of quality. Which is not as bold as it may sound, since we are only talking about 6 games. If we follow this more common sense approach rather than overreacting to a small sample size, it is probably reasonable to assume our Duke rating could be increased by only around 1 point rather than the full 2.2 point difference experienced in the 6 game outcomes.
How This Affects Duke's Championship Odds
Our base model that doesn't account for the Zion injury gives Duke a 20.0% chance of winning the NCAA Tournament, just barely over 19.7% and 19.5% figures for Virginia and Gonzaga respectively. If we inflate our Duke rating by 1.0 net points per game, which may be reasonable, those figures shift to 24% for Duke, 19% for Virginia, and 18% for Gonzaga. And a full 2.2 point inflation gives 30% for Duke, 18% for Virginia, and 17% for Gonzaga.
While bookmaker odds do appear closer to those final odds than the others, it doesn't appear that they can be justified by accounting for the Zion Williamson injury alone. If they are accurate, it would require some other explanation, such as that Duke simply didn't try their hardest in the regular season like an elite NBA team. However, it is difficult to account for how any such explanation would not equally apply to the other very dominant teams in college basketball this year.
| Recent Articles |
|---|
| If 2021 Had 16 Games - 1/10/22 |
| Wk 18 Playoff Scenarios 2021 - 1/8/22 |
| Wk 17 Playoff Scenarios 2020 - 1/1/21 |
| Wk 17 Playoff Scenarios 2019 - 12/27/19 |
| 2 Week Playoff Scenarios 2019 - 12/21/19 |
| 3 Week Playoff Tiebreakers 2019 - 12/11/19 |
| NFL Injury Point Value - 6/18/19 |
| How Teams Value Draft Picks - 4/25/19 |
| Analyzing The Zion Injury - 3/21/19 |
| Week 17 Playoff Scenarios 2018 - 12/27/18 |
| BUF | MIA | NE | NYJ | BAL | CIN | CLE | PIT | HOU | IND | JAC | TEN | DEN | KC | LV | LAC | |||||||||||||
| DAL | NYG | PHI | WAS | CHI | DET | GB | MIN | ATL | CAR | NO | TB | ARI | LAR | SF | SEA | |||||||||||||
| ProFootballLogic.com welcomes questions, requests, and error reports by email to contact@profootballlogic.com | ||||||||||||||||||||||||||||
| Privacy Policy | ||||||||||||||||||||||||||||
| Copyright © 2026 ProFootballLogic.com. All Rights Reserved. | ||||||||||||||||||||||||||||