|
|
||||||||||
| ARTICLES | TEAMS | STATS | RATINGS | STANDINGS | GAMES | SCHEDULE | PLAYERS | METHOD | SPORTS | |
College Yearly Rating Regression
By Michael Gertz
Wednesday, August 28, 2013
We know that our NFL team ratings usually regress from one year to the next by a factor of about 0.5, meaning that however far a team rating is from the league average of 0, it will on average be only half as far the following year. Essentially, on average very good teams are only partly good the following year, and very bad teams are only partly bad. That obviously won't be true for every team. Of very good teams, some will stay very good while others will drop all the way to league average, with the average team ending up as partly good.
Some sort of similar regression with a slope between 0 and 1 is nearly universal in sports. A value of 0 would be true parity, where team ratings changed basically randomly from year to year. A value of 1 would be a league where on average teams were just as good the following year as the previous. Things that increase the slope are the lack of a salary cap, longer player contracts, and a greater range in quality of general managers.
Part of the problem with classic sports analysis is that it often unknowingly assumes a slope of 1. When people project records for teams, they take their record from the previous season, and then adjust from there based on roster changes. In reality, they should be adjusting relative to a regressed value of last season's record. This concept is blatantly obvious for NFL teams that won 16 or 0 games the previous year, we all intuitively know that replicating that performance would be a miracle. While the impact is lessened for teams that won 11 or 5 games, it is still there, but people don't realize.
With 2 years of college football team Ratings now at ProFootballLogic, we can solve the for the amount of regression in college football. While the data is based on only 1 pair of seasons, the large number of Division I-A teams means the result is fairly reliable. Below is a graph comparing 2011 team ratings to 2012 ratings, with each dot representing a single school. Keep in mind the difference between two ratings is essentially a point spread for a game between the two teams at a neutral site.
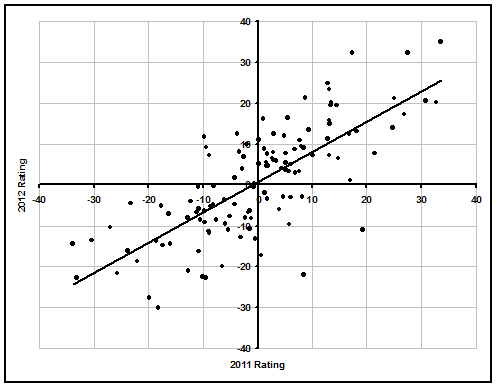
The slope of the best fit line comes out to 0.74, meaning a team's 2012 rating was on average their 2011 rating multiplied by 0.74. Despite most starters usually only lasting a year or two, and no money being involved (for the most part), the slope for college football is much higher than for the NFL. The reason for the increase is that despite a lack of salaries, college football has the form of a league with uncapped salaries. Better schools have more to offer to recruits, in the form of better facilities, coaching, academics, national exposure, and the ability to play on a better team. While it's questionable whether the right choice is actually to go to a good school where you might be a backup rather than a bad school where you are a guaranteed starter, players inevitably do make that choice often, whether due to their own ego or false trust in a coach giving a good recruiting pitch.
What does this all mean for your alma mater's expectations coming into the season? While roster change is still a very valid part of the analysis, it means that you should factor in roster change to adjust from 0.74 times your team's previous rating, not just to adjust straight from your team's previous rating.
| Recent Articles |
|---|
| If 2021 Had 16 Games - 1/10/22 |
| Wk 18 Playoff Scenarios 2021 - 1/8/22 |
| Wk 17 Playoff Scenarios 2020 - 1/1/21 |
| Wk 17 Playoff Scenarios 2019 - 12/27/19 |
| 2 Week Playoff Scenarios 2019 - 12/21/19 |
| 3 Week Playoff Tiebreakers 2019 - 12/11/19 |
| NFL Injury Point Value - 6/18/19 |
| How Teams Value Draft Picks - 4/25/19 |
| Analyzing The Zion Injury - 3/21/19 |
| Week 17 Playoff Scenarios 2018 - 12/27/18 |
| BUF | MIA | NE | NYJ | BAL | CIN | CLE | PIT | HOU | IND | JAC | TEN | DEN | KC | LV | LAC | |||||||||||||
| DAL | NYG | PHI | WAS | CHI | DET | GB | MIN | ATL | CAR | NO | TB | ARI | LAR | SF | SEA | |||||||||||||
| ProFootballLogic.com welcomes questions, requests, and error reports by email to contact@profootballlogic.com | ||||||||||||||||||||||||||||
| Privacy Policy | ||||||||||||||||||||||||||||
| Copyright © 2026 ProFootballLogic.com. All Rights Reserved. | ||||||||||||||||||||||||||||