|
|
||||||||||
| ARTICLES | TEAMS | STATS | RATINGS | STANDINGS | GAMES | SCHEDULE | PLAYERS | METHOD | SPORTS | |
Grading NFL Franchises
By Michael Gertz
Thursday, September 28, 2017
There are many reasonable ways to approach grading NFL franchises. But in this article specifically, we'll examine the last 15 seasons (since the latest 2002 expansion and realignment) in terms of wins per season and playoff advancement. During this span, the NFL has had very stable salary cap and standings rules, making it useful for a long term study.
Parity
How much parity has there been in the NFL in the last 15 years? Below is a chart of each of the 32 franchises in order of wins per season. The average team has been about 1.2 wins per season away from the average of 8 over the 15 seasons.
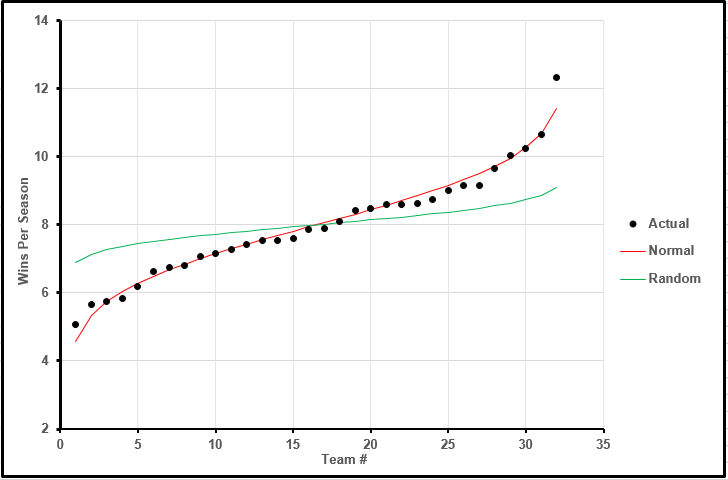
The black dots represent each of the 32 teams. The red curve is a cumulative normal distribution with a standard deviation of about 1.6 wins. The two together show that regular season success over the 15 season span in the NFL is very normally distributed (shaped like a bell curve if graphed as an individual probability rather than cumulatively).
The green curve is the result we would expect to see if all NFL teams were completely even all 15 seasons and every game was a coin toss. It roughly follows a normal distribution with a standard deviation of 0.5 wins. It may appear at first that this pure randomness can explain a sizable fraction of the actual variation, but running the actual math shows the opposite. The standard deviation of a normal distribution formed by adding 2 independent normal distributions is the square root of the sum of the squares of the standard deviations of the original distributions (the same as the Pythagorean theorem).
Therefore, subtracting the pure luck component of the variation still results in a standard deviation of the square root of (1.6^2 - 0.5^2), or about 1.5, which is nearly the same as the original red curve. In this sense, very little of the variation in wins among teams over this time span can be attributed to pure luck. The reason the pure luck component doesn't actually represent as much a role as it might appear in the graph is that the good teams haven't necessarily gotten most of the good luck and the bad teams haven't necessarily gotten most of the bad luck.
However, so far we have used a very strict definition of pure luck. In the NFL, some dumb luck can have huge implications for a decade. For instance, had a team assigned a 5th round value to Tom Brady rather than a 7th round value, they could have massively increased their average wins despite the average 5th vs 7th round QB evaluation being just a miniscule fraction of the total importance of all their evaluations over the years.
What this means essentially is that luck in one season can be strongly correlated to luck in the seasons that follow it. Therefore while "pure" luck plays little role in the actual distribution of team success, it is very difficult to analyze how much actual luck has been amplified over the years to make it look like certain teams have consistently made good or bad personnel decisions over a long period of time. What we can say though is that the graph above does largely describe the actual average quality of teams put forth by each franchise over the last 15 years.
Regular Season vs Playoff Success
Now that we've shown that team quality is closely tied to regular season wins over the 15 seasons (even if that quality was acquired luckily), let's see how closely regular season success tracks with postseason success. The graph below shows each team's regular season wins and playoff advancements per season from 2002-2016. Playoff advancements in this case is 1 point for making the wild card round, 2 for reaching the divisional round, 3 for reaching the conference championship, 4 for reaching the Super Bowl, or 5 for winning the Super Bowl.
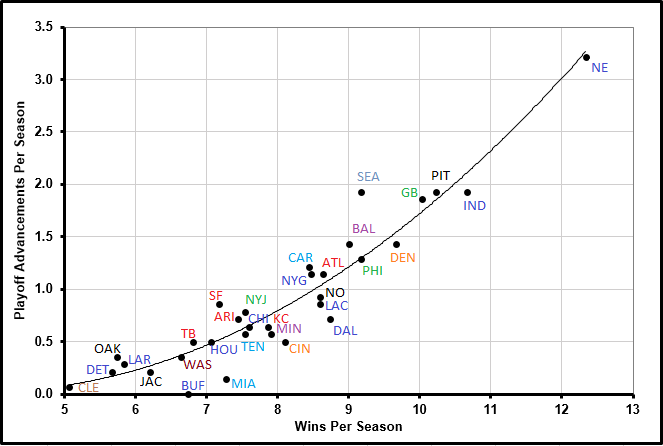
As a basic summary, teams above the trendline have been better (or luckier) in the playoffs than in the regular season, and vice versa. The one main exception to this general rule is that teams with some really good seasons and some really bad seasons will outperform teams with all mediocre seasons in terms of playoff success, because the playoffs disproportionally favor the very good teams.
Because of this, it can be beneficial for teams to sell out to win once they have a good team, at the expense of future seasons. This can be accomplished by manipulating the salary cap to effectively have a larger or smaller cap in certain years by shifting money around. For instance a good team may give a star player a contract that is heavy in money 3 years down the road but spares the team salary cap room in the near term.
Alternately, a bad team can load a star player's contract in the first couple years while they essentially tank those seasons so that a few years from then when they have a better team, they'll also have their star player at a huge discount. Of course, stuch strategies are much easier to implement if the GM has job security and can assume they will actually benefit from such decisions.
Grading Franchises
Most teams fall pretty close to the curving trendline, meaning their playoff success has been similar to their regular season prowess. But there are some important exceptions.
The biggest is probably the Seahawks. In addition to their 3 Super Bowl appearances, Seattle has benefitted from making the playoffs in both of their 9-7 seasons and even once at 7-9 thanks to the NFC West being weak for many of the 15 seasons. The 49ers have also outpaced their regular season average in the playoffs due to virtually all their success coming in a 3-year perfect storm of a quality roster and deep playoff runs.
At the other end of the spectrum are a couple of teams now known for folding in the playoffs: the Cowboys and Bengals. And indeed, their relative lack of playoff success has come from losing in the playoffs rather than a lack of playoff appearances. The Dolphins and Bills, on the other hand, have simply not made the playoffs enough due to being consistently just below average, even though neither fall in the bottom 5 NFL teams in wins. Buffalo is actually the only team to never make the playoffs in the last 15 years despite averaging almost 7 wins per year.
The final data point of significance is the Patriots. Their 12.3 average wins are over a whole win further from the average of 8 (above or below) than any other team. And their average playoff advancement is equivalent to reaching the conference championship every year, over a full round past any other team. While our trendline goes right through the New England data point, indicating they have only been as good as expected in the playoffs, a strong argument could be made that the actual line should have already tapered off by that point, but with no other teams in the vicinity it is difficult to know.
Clutch vs Lucky
While many people would interpret the graph above as a measure of how playoff clutch each team has been, such a description would likely be misguided. Many teams' playoff success varies largely based on only about 5-10 playoff games, so at such a small sample size it would be expected to see a wide range of success even if success was completely random. Further, since we are considering a range of 15 seasons, there is no reason to assume that clutchness would even remain constant for each team as most rosters almost completely turn over in a matter of only about 5 years.
Overall, the best takeaway of how good each franchise has been likely comes from their regular season wins. The playoff advancement metric we reference here though is an interesting proxy for the relevance of each franchise in terms of NFL history, lore, and fandom.
| Recent Articles |
|---|
| If 2021 Had 16 Games - 1/10/22 |
| Wk 18 Playoff Scenarios 2021 - 1/8/22 |
| Wk 17 Playoff Scenarios 2020 - 1/1/21 |
| Wk 17 Playoff Scenarios 2019 - 12/27/19 |
| 2 Week Playoff Scenarios 2019 - 12/21/19 |
| 3 Week Playoff Tiebreakers 2019 - 12/11/19 |
| NFL Injury Point Value - 6/18/19 |
| How Teams Value Draft Picks - 4/25/19 |
| Analyzing The Zion Injury - 3/21/19 |
| Week 17 Playoff Scenarios 2018 - 12/27/18 |
| BUF | MIA | NE | NYJ | BAL | CIN | CLE | PIT | HOU | IND | JAC | TEN | DEN | KC | LV | LAC | |||||||||||||
| DAL | NYG | PHI | WAS | CHI | DET | GB | MIN | ATL | CAR | NO | TB | ARI | LAR | SF | SEA | |||||||||||||
| ProFootballLogic.com welcomes questions, requests, and error reports by email to contact@profootballlogic.com | ||||||||||||||||||||||||||||
| Privacy Policy | ||||||||||||||||||||||||||||
| Copyright © 2026 ProFootballLogic.com. All Rights Reserved. | ||||||||||||||||||||||||||||