|
|
||||||||||
| ARTICLES | TEAMS | STATS | RATINGS | STANDINGS | GAMES | SCHEDULE | PLAYERS | METHOD | SPORTS | |
Developing a World Cup Model
By Michael Gertz
Monday, June 9, 2014
ProFootballLogic has formed a World Cup odds model for the 2014 World Cup. The resulting odds can be found in a table in our other sports section on the new Soccer page. A final update of the odds will be done once World Cup teams finish their pre-tournament friendlies. This article describes what went into the development of the model. Calculating odds for the NCAA basketball tournament can require managing a very large number of possibilities, but ultimately starts with a simple method of converting team ratings into odds of winning a game. The World Cup on the other hand presents a more difficult analysis, mostly due to the high likelihood of draws and the complex group stage where tiebreakers are often needed.
Turning Team Ratings Into Game Odds
Because national soccer teams don't play a standard season and only play games rarely over a long period of time, our standard approach to team ratings from other sports is not as adequate for international soccer. A more fitting estimation is the Elo rating system that was developed for chess player ratings. Elo ratings have already been adapted to national soccer teams at eloratings.net, so our World Cup odds begin by using those team ratings. Historical Elo ratings are also readily available, which gives a large amount of data for analyzing different aspects of the World Cup.
The Elo ratings change for each team after each game based on how the game result differs from what was expected coming into the game based on the teams' ratings. The team that wins will always gain Elo points and the loser will lose the same amount of Elo points, with the amount of points depending on how big a surprise it is that the winning team won, how many goals they won by, and the type of match. If a game ends in a draw, the elo points are awarded as if the worse team won, but to a much lesser extent.
Forming game odds from team ratings in other sports is a relatively simple process. All possible outcomes can be modeled by a normal distribution of probabilities. The mean of the distribution is the difference between the 2 teams' ratings, and the standard deviation is formed by a more advanced analysis of the league. The odds of each team winning are equal to the percent of the distribution that lays on their side of an exactly even game. But soccer presents a slight complication because of draws.
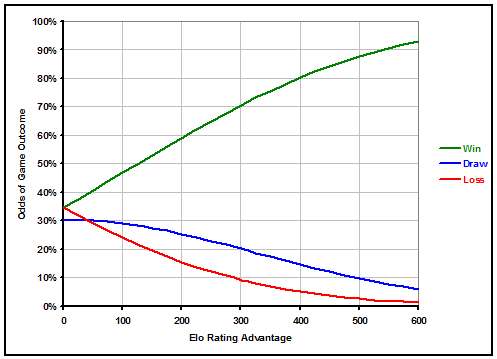
After analyzing how often wins, draws, or losses occur for teams facing inferior opponents of all different relative qualities, we found that rather than estimating probabilities for the 3 outcomes with complex equations for each, the almost exact same trendlines emerged by going back to a normal distribution analysis. This has the added benefit of automatically making sure that the odds of all 3 outcomes add to exactly 100%.
The one caveat was that the demarcation for draws doesn't fall exactly at 0.5 goals in favor of either team as would be expected from pure rounding, but closer to 0.6 goals in either team's favor. This is a wider range, meaning more draws than might be expected. Reasons for this could include flawed strategies by teams with the lead or more effort given by the losing side, but is likely more the result of referee bias towards helping the losing team get back in the game. Ironically, because 3 points are awarded for wins and just 1 for draws, if anything teams are incentivized to avoid draws, but most seem to still take the cautious approach anyway.
Below is graph displaying how likely it is that a better team wins, draws, or loses a match against a team with a worse Elo rating, depending on the Elo rating difference of the 2 teams. For reference, a 100 Elo points difference is equivalent to about a 0.475 goal expected edge in a game, and also equal to the expected edge that home field advantage provides. The chart goes up to a difference of 600 Elo points between 2 teams, which is about as lopsided as World Cup matches can get.
The Massive Impact of Home Field Advantage
The Elo rating system is designed such that home field advantage is worth exactly 100 Elo points. But does this factor hold up in the World Cup? Perhaps World Cup games have less home field advantage because more away fans travel to the games. Actually, our analysis reveals that if anything home field advantage may be stronger in World Cups. In 56 games involving host countries in the past 9 World Cups since 1978, hosts have outperformed an expected 100 Elo point advantage when using all teams' Elo ratings at the start of each World Cup.
7 of the 10 host nations outperformed standard home expectations, and on average hosts performed at a level equivalent to a 167 Elo point advantage. That value even increases to 187 Elo points when considering only the 5 most recent World Cups since 1994. And prior to 1978, without crunching the actual numbers, hosts appear to have done even better in final results than in the data we used. For comparison, in the next most prestigious international competition, the European Championship, over the past 31 games with hosts in 5 tournaments since 1996, hosts have performed at the equivalent of a 119 Elo point advantage. That is a much weaker edge, but still more than the standard 100.
All the evidence points towards big tournaments actually having a stronger home field advantage than the average game. There are a few possible explanations for this. Fans may be louder (and more imposing on refs) in big games. Also, in big tournaments there is generally a feeling of good will toward the host nation which could influence refs. However, the sample sizes are still not huge, so the increased strength of home field advantage could be a coincidence.
Because our odds for Brazil in the 2014 World Cup already exceed that of betting markets at the 100 Elo point standard, we have capped home field advantage at that mark to be safe. But it remains an interesting concept that home field advantage in the World Cup has by necessity a small sample size that no level of advanced analysis may be able to overcome. Even the smartest oddsmakers and bettors around are probably lying if they say they know with much certainty how strong of a home field advantage to expect in the World Cup.
That is an important fact especially this year because of how much a small swing in home field advantage can impact expected results from the 2014 World Cup, where the hosts are already universally regarded as one of the top teams. Below is a table examining our odds for the top contenders to win the World Cup as a function of how much importance we put on home field advantage. The values range from 0 to 167 Elo points, representing all the way from no home field advantage to the massive home field advantage seen in past World Cups. We can see that even using our standard edge of 100 Elo points, home field advantage boosts Brazil from 23% all the way to 40% compared to if the tournament took place at a neutral site, almost doubling their odds of winning the World Cup.
| Odds to Win 2014 World Cup Depending on Home Field Factor | |||
|---|---|---|---|
| Team | 0 Elo | 100 Elo | 167 Elo |
| Brazil | 23% | 40% | 52% |
| Spain | 20% | 16% | 13% |
| Germany | 19% | 15% | 12% |
| Argentina | 10% | 8% | 6% |
| Others | 28% | 21% | 17% |
Extra Time and Penalties are Close to a Coin Flip
The final additional piece of analysis that is necessary is what to expect after draws in the knockout rounds. In the event of extra time and possibly penalties, we need to know how often the better team will ultimately win. To find out, we took 39 games from recent World Cups and Euros that went into extra time, and regressed to find out how often the better team ultimately won depending on how much better they were.
The results are in the graph below. It is again a somewhat small sample size, but should give a relatively decent estimate. Essentially, for every 100 Elo point edge a team has, they're odds of winning in extra time or penalties go up about 4%. That means that most games that reach extra time will be a 60%/40% or closer proposition, and only the most lopsided of World Cup matchups would hit a 70%/30% split after reaching extra time.
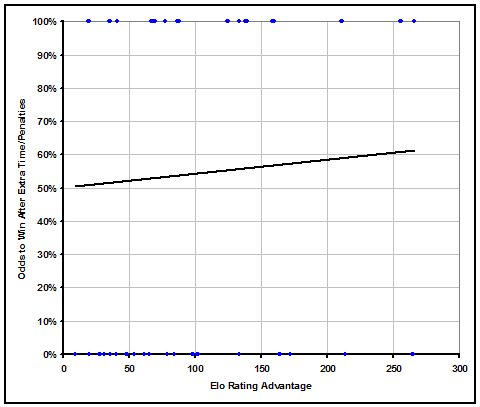
These results make some intuitive sense because extra time is only 1/3rd as long as regulation, so better teams are much less likely to be able to pull away from worse teams. And should games go on to penalties, as they did in about half of our sample games, better teams have even less of an advantage.
With all of these intricacies of the World Cup tournament solved, we then simulate the entire tournament 10,000 times. The results give several sets of odds for each team including odds of finishing in each place in their group, advancing through each round, and finishing in each of the top 4 positions. Again, all these odds can be found on our Soccer page here.
| Recent Articles |
|---|
| If 2021 Had 16 Games - 1/10/22 |
| Wk 18 Playoff Scenarios 2021 - 1/8/22 |
| Wk 17 Playoff Scenarios 2020 - 1/1/21 |
| Wk 17 Playoff Scenarios 2019 - 12/27/19 |
| 2 Week Playoff Scenarios 2019 - 12/21/19 |
| 3 Week Playoff Tiebreakers 2019 - 12/11/19 |
| NFL Injury Point Value - 6/18/19 |
| How Teams Value Draft Picks - 4/25/19 |
| Analyzing The Zion Injury - 3/21/19 |
| Week 17 Playoff Scenarios 2018 - 12/27/18 |
| BUF | MIA | NE | NYJ | BAL | CIN | CLE | PIT | HOU | IND | JAC | TEN | DEN | KC | LV | LAC | |||||||||||||
| DAL | NYG | PHI | WAS | CHI | DET | GB | MIN | ATL | CAR | NO | TB | ARI | LAR | SF | SEA | |||||||||||||
| ProFootballLogic.com welcomes questions, requests, and error reports by email to contact@profootballlogic.com | ||||||||||||||||||||||||||||
| Privacy Policy | ||||||||||||||||||||||||||||
| Copyright © 2026 ProFootballLogic.com. All Rights Reserved. | ||||||||||||||||||||||||||||