|
|
||||||||||
| ARTICLES | TEAMS | STATS | RATINGS | STANDINGS | GAMES | SCHEDULE | PLAYERS | METHOD | SPORTS | |
The Changing Landscape of the NFL
By Michael Gertz
Tuesday, May 21, 2013
We all know that the NFL has been constantly evolving since its inception from a running game to a passing game. But rarely do NFL analysts actually present the data behind this phenomenon when stating potential reasons behind the changes. Here we take a look at how the NFL has noticeably changed even in just the last 4 years through our advanced stats, as well as how the league has changed since its beginnings using more basic historical stats.
Below is a table of league average offensive efficiency over the last 4 seasons, in values of expected points added (EPA). EPA stats are an accumulation of point values assigned to describe the success of every play, a breakdown of how each play contributed to a game's final score difference (See a full explanation of EPA stats in our Stats Explained article). A full key for each play type category description is at the bottom of the Stats page, but the main takeaway for our purposes is that the "Pass" category includes only pass plays that don't already fall into the interception or sack category.
| League Average Offensive EPA Per Game | |||||||||||||
|---|---|---|---|---|---|---|---|---|---|---|---|---|---|
| Year | Int | Sack | Pass | Run | KO | Abo | FG | Punt | Pen | TO | Kn | EOH | Total |
| 2009 | -3.3 | -2.9 | 9.8 | 0.8 | -0.3 | -0.3 | 0.0 | 0.5 | -0.6 | -1.9 | -0.2 | -0.8 | 0.6 |
| 2010 | -3.3 | -2.9 | 10.1 | 0.4 | -0.2 | -0.4 | 0.0 | 0.2 | -0.5 | -1.9 | -0.2 | -0.7 | 0.7 |
| 2011 | -3.4 | -3.1 | 10.4 | 0.6 | -1.3 | -0.3 | 0.1 | 0.5 | -0.5 | -1.6 | -0.2 | -0.8 | 0.3 |
| 2012 | -3.3 | -3.0 | 10.8 | 0.6 | -1.4 | -0.3 | 0.2 | 0.7 | -0.4 | -1.6 | -0.2 | -0.7 | 1.3 |
While most play types have kept a relatively constant level of efficiency for offensive, there are 2 columns that jump out. First, obviously the kickoff category saw a major drop in 2011, when kickoffs were moved up to the 35 yard line from the 30. The rule change cost the returning team about 1 point per game of productivity. That drop has been largely counteracted though by the other main change, a constant increase is offensive passing efficiency. Over the 4 year span, the impact of interceptions and sacks has been relatively constant, but other pass plays have increased offensive efficiency each year by about 0.3 points per game.
Most other changes in this short time frame have been relatively minor, but have generally favored offenses as well. Field goal attempts have had slightly better success, verifying conventional perceptions that kickers have been improving. Success while punting and turnovers from fumbles (TO) have seen barely detectable shifts favoring offenses as well, but these categories are also some of the most inconsistent and prone to random variations.
With the kickoff change being a one-time thing rather than a general trend, it appears that success on non-interception, non-sack pass plays is the main currently changing aspect of NFL offensive efficiency. Because this category for us is on a per-game basis, and includes pass plays with penalties, there are 3 main explanations possible. Offensive pass units may simply be getting better (or at least outpacing pass defenses), offenses may simply be running more pass plays (or plays in general due to no huddle up-tempo offenses), or the changes may be strictly the result of recent rules changes such as helmet-to-helmet hits which primarily penalize the defense. All 3 of these explanations are routinely given by analysts, but rarely with facts to back them up.
Actually, recent stats do support a possible combination of all 3 explanations. Over the last 4 years, offenses have had about 1.4 more passing plays per game, generated about 0.1 more yards per pass attempt, and have benefitted from about 4 more general penalty yards (on all play types combined) per game. Let's dive a little deeper historically with basic statistics to see how consistent these trends are in the long term.
A History of NFL Run/Pass Balance and Offensive Efficiency
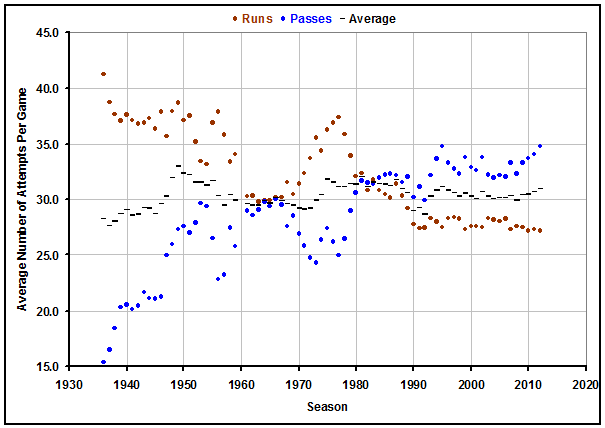
The idea that the NFL has made a slow but steady transition from a running league to a passing league over its history would seem to be a safe and common assumption, but in fact the evolution has been filled with peaks and valleys. Below is a graph of NFL play calling all the way back to the league's infancy in 1936 (AFL stats are included for '61-'69). The black dashed lines represent an average of run plays + pass plays, an indication of how the total number of plays in a game has changed due to tempo or rule changes. Also, because sacks did not become an official stat until 1963 (and scrambles still aren't), this chart represents just pass attempts rather than actual pass plays called. Adding about 3 to every pass data marker would give an indication of how often passes are called in the huddle.
Before analyzing, let's first take a look at a couple other graphs to see how well the swings in play calling actually correlate to efficiency statistics. Below is a graph of yards per attempt for rushing and passing over the decades. The one caveat here is that we've made a rough correction for the fact that sack yardage was clumped into rushing totals instead of passing totals prior to 1963, so the raw data actually shows a sudden increase in rushing efficiency and sudden dropoff in passing efficiency in that year. While the exact sack yardage numbers are unknown, we estimated them in a way that kept the seemingly rather consistent rushing numbers in a straight line.
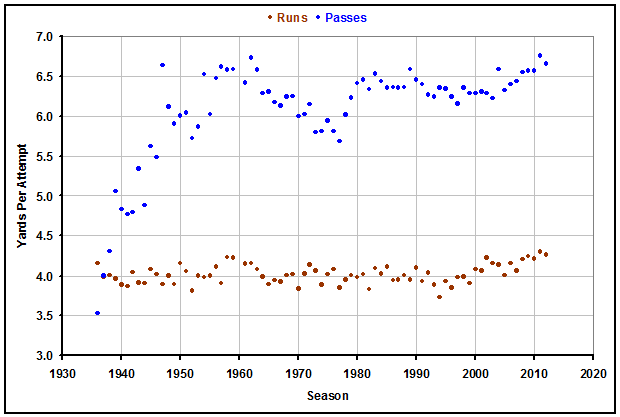
The two charts do mirror each other somewhat well, but the results seem to indicate that passing was nearly as efficient decades ago as it is now. But this inconsistency is resolved by our final graph of the other aspects of pass plays: interceptions and sacks. The chart below tells perhaps the most remarkable and under-reported story in NFL history.
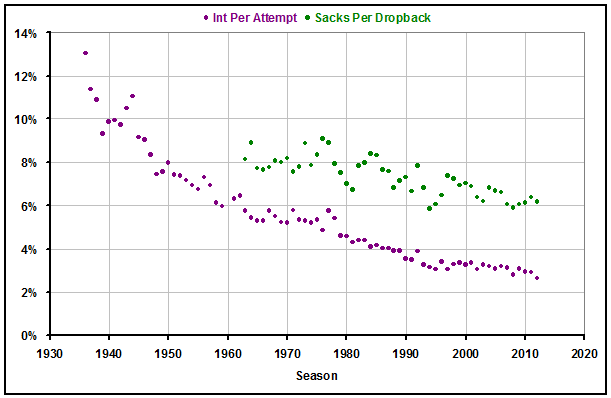
Interception rates have dropped tremendously over the course of NFL history, and in a very consistently smooth curve at that! Sack rates have decreased as well, but just slightly. While the yards per attempt graph explains short term trends in play calling, this interception graph gives an explanation for the long term trend that the other alone cannot.
A Model of NFL Offensive Efficiency
To estimate how much interceptions have affected offensive efficiency over the years, we come full circle back to expected points added (EPA). Thanks to our advanced stats, we know exactly how much (at least in today's NFL) things like interceptions, sacks, other pass plays, or runs affect a game on average. Combining our values for each play type with the historical data for how often each play type occurred, we can establish a very rough estimate of historical EPA efficiency over the years.
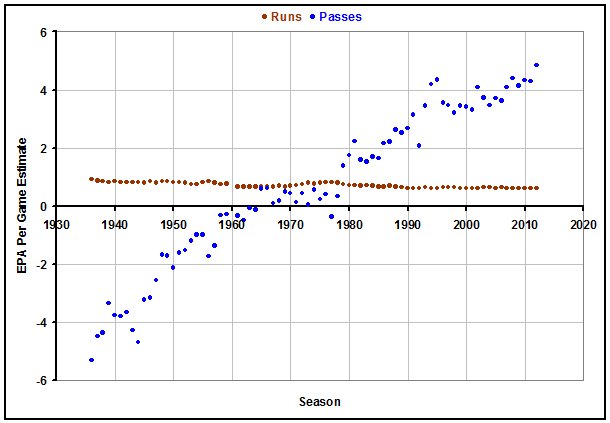
While obviously the value of a pass, run, interception, and sack has changed some over time, those changes are nearly impossible to estimate, so the chart shows a "best guess" as to the actual value of rushing vs passing throughout NFL history. While the effectiveness of rushing, as seen in the yards per attempt graph, has stayed nearly constant over time, the decrease in interceptions has allowed passing to overtake that level of effectiveness. Once that occurred, the ability to decide to pass the ball more times per game helped to multiply that impact, further increasing the expected points added from passing per game.
The Impact of Refs and Rules
To this point, we've skimmed over short term changes to passing efficiency and play calling to address the long term trend, but now let's look at some possible explanations for the strange year-to-year variations that go against the grain. Changes to the rulebook and enforcement of how physical a defense can be against receivers has clearly played a big role in shaping the NFL.
In 1978, perhaps the most drastic rule changes in the Super Bowl era were passed. Defenders were no longer allowed to contact receivers more than 5 yards downfield, and pass blockers were given more freedom to stay engaged with pass rushers. The results of the changes are clearly seen in the yards per attempt and play calling graphs. The years after 1978 saw a dramatic increase in passing efficiency. The 5 yard contact rule was re-emphasized for the 2004 season, and while the results were not as strong, they appear to again corrolate to an increase in passing efficiency and play selection.
There remains the question of why passing efficiency and frequency declined from 1960-77 and flattened from about 1980-2003. This may be partially explained by refs gradually letting defenders get away with more contact. Another reasonable explanation could be the expansion of the league in number of teams. Though expansion caused defenses to be diluted just like offenses, our analysis shows at least in recent years that offenses have more impact on a game than defenses. Evidence against the expansion argument would include the jump from 12 to 22 teams with the establishment of the AFL in 1960, which did not immediately see a decrease in passing efficiency.
Below is a graph of average penalty yards per team per game over NFL history. While not entirely useful because we don't know which types of penalties the yards came from, we can see that the pre-Super Bowl era saw a huge increase and then decrease in penalty yardage. In the Super Bowl era, penalty yardage has been rather inconsistent from year to year, but has no long term trend.
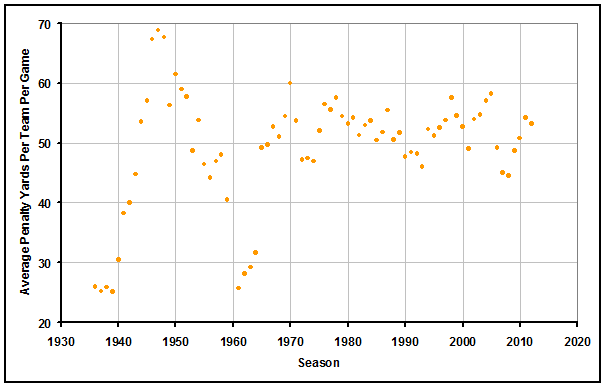
The recent increase in penalty yards in the last 4 years doesn't especially stand out, meaning that hopefully the safety-based rules changes implemented recently will not take penalty yardage to a new high.
The Future of NFL Run/Pass Balance and Play Selection
Given the increase in passing over the years, it is a reasonable concern to football purists that the dichotomy of play calling in the NFL could disappear as rushing becomes a strategy only used in rare situations. Combined with the fact that many recent rules changes have favored passing offenses, and that history has shown rules changes can have big impacts, the NFL may indeed be on a course of no return.
The most promising piece of data to suggest that the dynamics of the NFL won't continue to change in the future is the influence of interception rates on passing efficiency. Declining interception rates have been a major driving force in increased passing efficiency. While interception rates may never increase, they are decreasing by less and less each season as the curve flattens out while approaching the 0% barrier. This means that there is still a chance that passing efficiency as a whole could mostly level out in the long term as well.
With that said, one debate rages on: if passing is more efficient than rushing on average, shouldn't teams end up passing more often even if current levels remain? We approached this question more fully in our General Play Type Analysis article, but here are the basics.
The fact that payoffs are unequal for rushing and passing proves that either offenses or defenses are using a suboptimal strategy. The argument that "if offenses passed more, defenses would counter by gearing towards passes as well" is invalid. If that were the case, it would mean the new defensive strategy was also better at defending the current run/pass ratio. Therefore if teams tend to get smarter in the future, either offenses will pass more, or defenses will be more geared towards the pass.
Most likely, both will occur, but the bigger inefficiency right now is probably from offenses' excessive dedication to running the ball. That means that even with interception rate decreases leveling out, there is probably still room for passing offenses to increase efficiency through play calling.
Common explanations for offenses running too often are risk aversion and a tendency for coaching to lag behind the changing landscape of the NFL. Interestingly though, there was a time in the 1960s when passes were called more often than runs, despite our EPA estimates showing that rushing may have been more efficient. This is partially attributable to the upstart AFL, where teams passed 2 more times per game than in the NFL, despite being slightly less efficient. This period serves as a possible counterargument to the explanations above, though the aspect of risk aversion has been amplified in recent years by the increased media and fan feedback.
| Recent Articles |
|---|
| If 2021 Had 16 Games - 1/10/22 |
| Wk 18 Playoff Scenarios 2021 - 1/8/22 |
| Wk 17 Playoff Scenarios 2020 - 1/1/21 |
| Wk 17 Playoff Scenarios 2019 - 12/27/19 |
| 2 Week Playoff Scenarios 2019 - 12/21/19 |
| 3 Week Playoff Tiebreakers 2019 - 12/11/19 |
| NFL Injury Point Value - 6/18/19 |
| How Teams Value Draft Picks - 4/25/19 |
| Analyzing The Zion Injury - 3/21/19 |
| Week 17 Playoff Scenarios 2018 - 12/27/18 |
| BUF | MIA | NE | NYJ | BAL | CIN | CLE | PIT | HOU | IND | JAC | TEN | DEN | KC | LV | LAC | |||||||||||||
| DAL | NYG | PHI | WAS | CHI | DET | GB | MIN | ATL | CAR | NO | TB | ARI | LAR | SF | SEA | |||||||||||||
| ProFootballLogic.com welcomes questions, requests, and error reports by email to contact@profootballlogic.com | ||||||||||||||||||||||||||||
| Privacy Policy | ||||||||||||||||||||||||||||
| Copyright © 2026 ProFootballLogic.com. All Rights Reserved. | ||||||||||||||||||||||||||||