|
|
||||||||||
| ARTICLES | TEAMS | STATS | RATINGS | STANDINGS | GAMES | SCHEDULE | PLAYERS | METHOD | SPORTS | |
NFL Injury Point Value
By Michael Gertz
Tuesday, June 18, 2019
"The best ability is availability." It's an overused cliche that represents a bit of truth, but often attributes an injury-prone status to certain players who may have just randomly been unlucky with injuries. However, while the actual predictability of injuries remains an issue, the phrase may actually be best applied at the team level. That's because over the course of an entire season, an accumulation of important injuries can be just as important as the actual ability of the players that start Week 1.
Most people who follow the NFL closely have a sense that injuries can often derail a season for a team, and that staying healthy can be a key component to making a postseason run. But due to the unique nature of our Team Ratings and how they are tied to each player's Snap Proportions, we can actually use them to finally quantify the impact that injuries have on an NFL team over the course of a season.
The Impact of Injuries on Team Ratings
Our team ratings are unique to each individual week of the NFL season. They estimate a net point per game value of each player based on his rating, snap proportion, and position. These values are then added together for an overall team rating which varies from week to week.
During each season, we update our player ratings, which affects weekly changes to our team ratings. But for this analysis, we can simply take our current retrospective (our best estimate looking back) ratings for each player. This amounts to a single value for each player for the entirety of the 2018 season. Now the only factor that varies in this analysis is a player's snap proportion for each week.
Therefore, our team ratings model is ready-made for analyzing some interesting aspects of team dynamics. The graph below shows how much each team's rating varies throughout 2018 depending solely on the snap proportions of each player. Each team's ratings have been normalized to set their Week 1 rating at 0, so each week after that is their rating relative to their Week 1 rating.
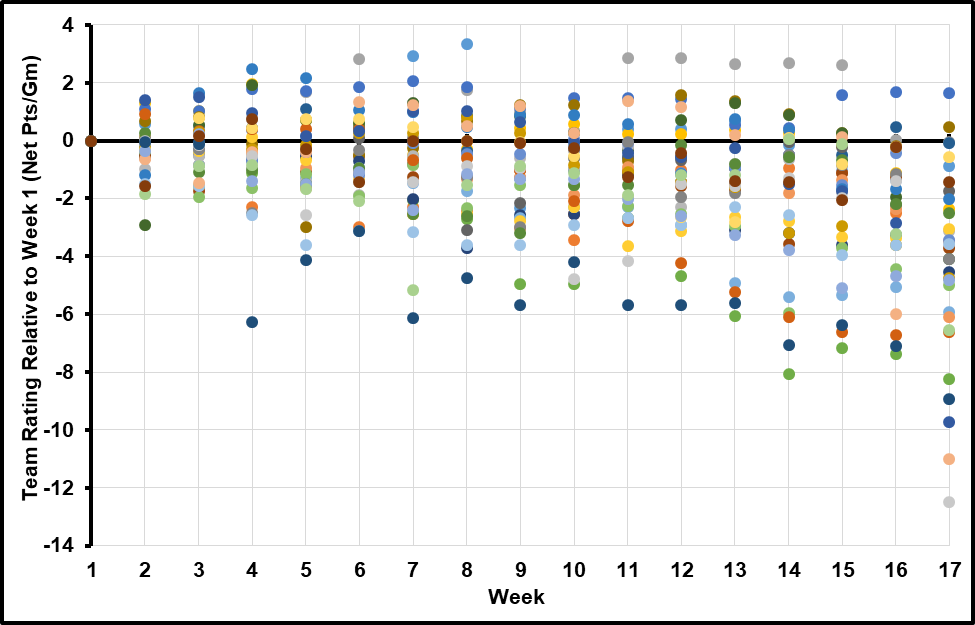
At this point we need to clarify a couple of caveats. First, while all the changes are due to player snap proportions, it obviously can't be assumed that all the changes are therefore due to injuries. Many times these proportions change over the course of the season due simply to coaching decisions, with those at QB being particularly impactful.
However, these coaching decisions often can increase a rating either up or down, and on average it could probably be assumed that they would increase a team's rating over time as coaches change toward the better players. This would mean that any overall downward movement of team ratings could actually underrate the impact that injuries had.
Second, while Week 1 is on average a team's highest rating of the season, it doesn't always represent a team at full health. Not only do some players miss the whole season due to a prior injury, but some also miss the start of the season with an injury before rejoining. As stated above, some teams will peak later in the season by shifting snaps to better players. And some will even benefit from injuries if our player ratings estimate that the backup was actually better than the starter anyway.
We haven't bothered to identify each of the 32 teams in the graph because it wouldn't be clear anyway, but the point is just to show the overall distribution of how all the teams in the league vary over the season. The graph below simplifies the same data into an overall average. The league mean for each week is shown in blue while the median is shown in red.

We can see that over the first 13 weeks or so, teams generally decrease in quality by about a half point each 5 games in a relatively linear manner. In the final 4 weeks or so, the dropoff starts to increase dramatically. For the most part, this drop is attributable to eliminated teams giving increased snaps to younger players to evaluate them and let them gain experience. The drop again increases in the final week or two, when a few teams that have already clinched certain playoff seeds rest key starters, often resulting in a huge decrease to their team rating for relatively meaningless games.
For most of the season, the mean and median drop in a team's rating are basically equivalent, and the distribution among teams appears to approximately follow a normal distribution for any given week. But as expected from the explanations above, the final weeks of the season result in a distribution that is skewed downward, where most teams remain normally distributed, but some disproportionately drag the mean below the median.
On the whole, the amount of decrease in team quality is pretty remarkable to see visually, but still aligns with what could be guessed if really thinking about it. Even apart from the late season dynamics, the average team is about 2 net points per game worse by the end of the regular season. Which is essentially to say that if the average NFL team's Week 1 lineup played their Week 17 lineup, the difference would probably round up to the Week 1 version being a 3 point favorite.
Another way to think of that overall 2 point value is that it is roughly equivalent to losing 2 Pro Bowl caliber players per team. Of course, the drop is rarely attributed to that small a number of injuries, and is usually divided up among several less impactful losses.
A final reference point is that the standard deviation of team ratings in Week 1 is generally just over 3 points. This essentially means that an average Week 17 team (that was still trying to win) would only be better than around 25% of the league's Week 1 teams. Or in other terms, an average Week 1 team would become a playoff caliber team by the end of the season simply by avoiding any major injuries.
How Injury Impact Varies Among Teams
While the second graph gives league averages, we could see from the first graph that there is a large degree of variation in the amount that each team decreases in quality over the course of the season.
In the final graph below, we've quantified this variation in terms of a standard deviation of the amount team ratings have changed since Week 1, for each week of the season.
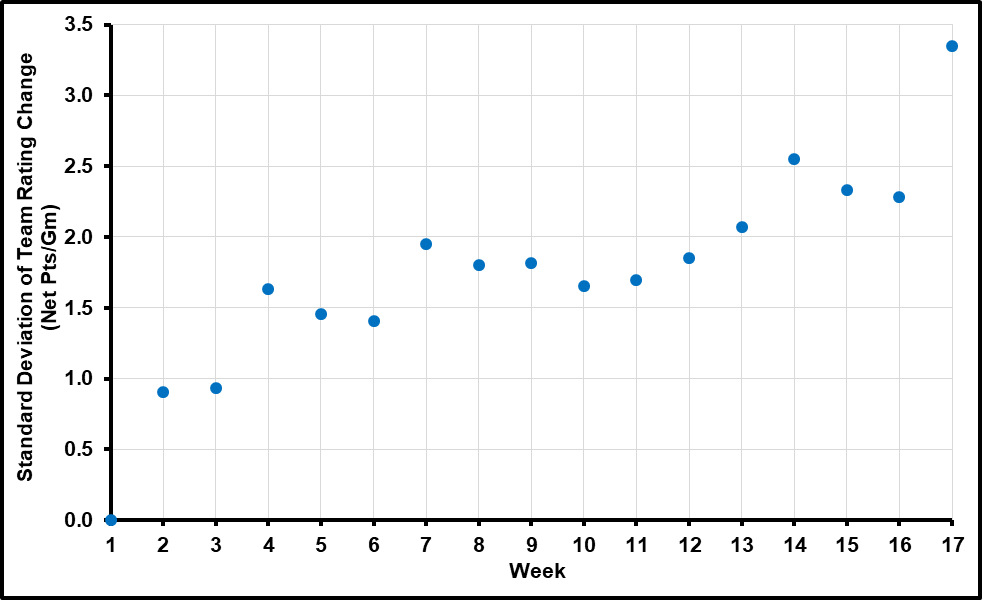
Because a team's injury rate at one point in the season doesn't particularly correlate to their injury rate at a different point in the season, the variation increases quickly to begin with, but while it always increases, its growth tapers off as the season goes on. Although this pattern again is countered toward the very end of the season by the factors mentioned above.
In the later half of the season, the standard deviation of the team rating change hovers around 2 net points per game. If we assume most of this variation is the result of injuries, this would mean that in the later portions of the season, injuries present perhaps around half as much variation as the actual quality of the teams' players coming into the season (which we stated above as just over 3).
Of course, injuries play a bit less of a role in the early part of the season, so a more accurate full season estimate could be a bit lower than the 1:2 ratio of injuries to skill in terms of the factors that contribute to success. Still, it is clear that the level of injuries a team sustains can play a huge role in their season outcome. And this is particularly true for playoff success, at the point in the season where injury impact is the greatest and most variable between teams.
How Team Construction Can Affect Injury Impact
Obviously, some teams could be purposely selecting players with low injury risk. Others could even favor high injury risk players if they believe other teams are overly discounting them. However, we suspect this aspect doesn't vary too greatly among teams. This is mostly because injury risk is very difficult to actually predict, especially considering that for many players those predictions would be based only on college careers.
However, there are also other variations in strategy that teams can have in attempting to minimize their injury risk. Essentially, this revolves around constructing a team that is optimized for a certain amount of injuries. For instance, certain teams may take a "Super Bowl or bust" strategy, essentially spending all their salary and draft capital on starters, with the idea that if they suffer many injuries they won't win the Super Bowl anyway, so why bother making sure they can still be decent if they do suffer many injuries.
Others, however, may employ more of a "don't let injuries ruin the season" strategy where they attempt to have solid backups at most positions, or happen to prefer rotating more starters anyway such that they can take over the snaps of any one that is injured. These teams would likely tend to fare better in our analysis above. This situation may also simply naturally occur for certain teams if many drafted players happen to develop into quality backup level players but not quite starters.
Also, some teams may simply be better at preparing for injuries by identifying the parts of their team that are more important to have better backups at, or maximizing the versatility of their backups so that they could cover in the event of many different possible injuries to starters. For all these reasons, we can't assume that the variation among teams in terms of injury costs is totally random, although we suspect that much of it is.
The Effect of an 18 Game Season
It appears that the accumulated impact of injuries in the NFL makes teams worse at a pretty linear rate, assuming as we have above that the large sudden drop-off in team quality at the end of the season is due to coaching decisions during meaningless games rather than an increase in injuries. As such, we can extrapolate that if the NFL increased the season to 18 games, the general season long drop would continue such that another 2 weeks would make the average team worse by an additional about 0.2 or 0.3 points more over the course of a regular season Week 18 and 19. And accordingly, each round of the Playoffs would experience that amount of difference.
Because the late-season coaching effects that were described above are due to season scenarios rather than injuries or Week numbers, we would expect them to shift back to stay in final weeks of the season. An increase in season length would inevitably also increase the amount of meaningless games somewhat, so those effects could also expand a bit, and into a larger number of the final weeks of the season.
| Recent Articles |
|---|
| If 2021 Had 16 Games - 1/10/22 |
| Wk 18 Playoff Scenarios 2021 - 1/8/22 |
| Wk 17 Playoff Scenarios 2020 - 1/1/21 |
| Wk 17 Playoff Scenarios 2019 - 12/27/19 |
| 2 Week Playoff Scenarios 2019 - 12/21/19 |
| 3 Week Playoff Tiebreakers 2019 - 12/11/19 |
| NFL Injury Point Value - 6/18/19 |
| How Teams Value Draft Picks - 4/25/19 |
| Analyzing The Zion Injury - 3/21/19 |
| Week 17 Playoff Scenarios 2018 - 12/27/18 |
| BUF | MIA | NE | NYJ | BAL | CIN | CLE | PIT | HOU | IND | JAC | TEN | DEN | KC | LV | LAC | |||||||||||||
| DAL | NYG | PHI | WAS | CHI | DET | GB | MIN | ATL | CAR | NO | TB | ARI | LAR | SF | SEA | |||||||||||||
| ProFootballLogic.com welcomes questions, requests, and error reports by email to contact@profootballlogic.com | ||||||||||||||||||||||||||||
| Privacy Policy | ||||||||||||||||||||||||||||
| Copyright © 2026 ProFootballLogic.com. All Rights Reserved. | ||||||||||||||||||||||||||||