|
|
||||||||||
| ARTICLES | TEAMS | STATS | RATINGS | STANDINGS | GAMES | SCHEDULE | PLAYERS | METHOD | SPORTS | |
NFL Injury Rate Analysis
By Michael Gertz
Monday, February 22, 2016
Over the course of the 2015 NFL season, we have meticulously tracked player snaps and injuries each week throughout the entire league to produce the most accurate team ratings possible. One great side benefit of this process is the ability to analyze how often injuries occur, to whom they occur, and for how long they last. In this article we examine the injury rate over the course of the 2015 NFL season of all players that were on rosters at the end of the season.
Only injuries that resulted in a player missing games thereafter are considered. Only injuries occurring in Weeks 1-16 are counted because injuries following Week 17 would be unknown. Preseason injuries that lasted into the regular season are not included. Overall, 1794 players were examined (excluding kickers, punters, and long snappers). 882 separate injuries were recorded among the 688 players (38%) that missed at least 1 game due to injury. 45% of players managed to be available for all 16 possible games, while the remaining 17% avoided injury, but were not on a 53-man roster for all 16 games.
Injury Rates By Position
The table below sums up injury rates for each position and totals for all positions. Further explanations and details follow the chart.
| 2015 NFL Injury Data | |||||
|---|---|---|---|---|---|
| Position | Games | Injuries/Game | Snap % | Avg Inj Length (G) | Games Available of 16 |
| All | 21493 | 4.1% | 49% | 3.1 | 14.2 |
| CB | 2219 | 4.4% | 54% | 2.9 | 14.2 |
| DE | 2117 | 3.9% | 46% | 3.0 | 14.3 |
| DT | 1271 | 4.3% | 43% | 2.9 | 14.2 |
| FB | 394 | 1.5% | 21% | 1.8 | 15.6 |
| LB | 3331 | 4.3% | 44% | 3.0 | 14.2 |
| OL | 3851 | 3.4% | 62% | 3.3 | 14.4 |
| QB | 1137 | 2.5% | 42% | 3.1 | 14.9 |
| RB | 1487 | 5.2% | 31% | 3.9 | 13.3 |
| S | 1954 | 4.7% | 53% | 3.0 | 14.0 |
| TE | 1351 | 4.9% | 45% | 2.6 | 14.2 |
| WR | 2381 | 4.5% | 50% | 3.2 | 14.0 |
As shown in the table, the average NFL player has about a 4.1% chance each game of suffering an injury that will prevent them from playing in the following game. The average injury that does cause a player to miss at least 1 game has a mean average length of 3.1 games missed. All told, a typical NFL player can expect to be healthy and available for about 14.2 games out of 16 per season.
Overall, injury rates are fairly consistent across different positions, with a few exceptions. As expected, running backs are at the highest risk of injury, and their injuries average significantly longer in length than any other position. The data shows fullback surprisingly at a low risk, but it is the only position that really has too small a sample size (just 6 injuries) to draw conclusions based on their low usage. Quarterbacks and offensive lineman are least likely to be injured, but the risk for starters at those positions is still similar to other positions as explained below.
Adjusting for Playing Time
At this point, you may be wondering "what good are per game averages if some players are out on the field all game while others sit on the bench?". And you would be right. Iniitally, we intended to analyze the injury rate on a per snap basis. But perhaps the most surprising finding in the whole analysis is that overall, the percentage of snaps a player plays in a game doesn't have much predictive value toward whether they will be injured.
It seems counterintuitive, but anyone who has spent much time looking through weekly injury reports can confirm that they have probably been surprised to find that about half the players on them each week don't even regularly see a starter's share of snaps. So what gives? Our most reasonable conclusion is that the explanation lies in the combination of the following factors:
-Special teams: Our snap counts don't include special teams snaps, which can be some of the most demanding snaps in a game. And backups with less scrimmage snaps are likely to play more special teams snaps. However, while we didn't track exact special teams data, a general look at special teams snap counts shows that it alone probably isn't a huge factor.
-Injuries during practice: These injuries may be more common than expected. While it is difficult to even find comprehensive reporting about when many NFL injuries occurred, a general examination of what is available seems to indicate that practice alone doesn't have a huge impact either. With that said, many backups see just as many snaps in practice as starters, and are more likely to also have to practice special teams plays.
-Backups more prone to injury: It is extremely difficult to try to compare how much this is true relative to the 2 explanations above. While it is unlikely that seeing more consistent game contact could make starters more durable, an explanation that flips the causation is more reasonable, following the adage that "your best ability is availability". It is easier for those players that are less injury prone to establish larger roles, and maintain their athleticism through the years. Young backups may be a mix of durable and fragile players, whereas only those more durable ones will last to develop into veteran starters.
-Coaching decisions: The difference between a 1st stringer and a 2nd stringer is usually larger than that between a 2nd and 3rd stringer. Therefore, if a player is only 90% healthy, the coach is more likely let them play if they are a starter. On top of that, the coach is more likely to feel comfortable with playing a starter who has missed practice than a backup who is less experienced.
The first 2 reasons explain how being a backup may actually cause a player to suffer more injuries relative to playing time. The final 2 reasons, which we suspect may actually have more impact, could explain the data without that actually being the case. The factors above may explain why we find that for most positions, the percentage of snaps played by a player doesn't impact their injury likelihood.
However, there were a few exceptions. The most notable were quarterback, and then offensive lineman. Despite being 2 of the least injury prone positions on a per game basis, those positions do show strong correlations between snaps and injuries. On a per snap basis, their injury rates are more similar to other positions. This makes some sense as backups at those positons are less likely to see time on special teams. Running back was the only other position that showed some correlation between snap % and injuries, though not as strong as QB and OL.
Injury Length
While the mean length of an injury is 3.1 games missed, the mean in this case is much higher than the median due to the skewed nature of the data. 64% of injuries that cause at least 1 game to be missed result in just 2 or less games being missed. Below is a graph of all 2015 injuries by the number of games they caused a player to miss.
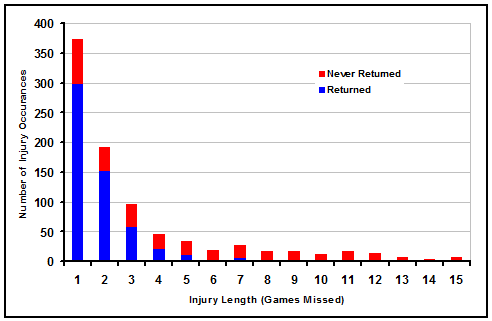
The blue portion represents players who returned from their injury to play later in the season, while those in red stayed injured through Week 17 and never returned to action. Keep in mind that those in red don't necessarily indicate how long an injury would last, just how many games were missed. For instance, a player tearing an ACL in Week 14 would only miss 3 games despite the injury being severe enough to spoil an entire season if suffered earlier on.
However, the reverse is true as well for those in red. If we try to do an analysis of how long injury recoveries actually take by assuming that recovery time doesn't depend on when the injury occurred, the numbers don't add up. In fact, almost half of all "season-ending" injuries can't be explained. That is because of the nature of the Injured Reserve list.
Any time a team doesn't deem a player's contributions in future healthy weeks to be more valuable than his spot on the 53-man roster during his injured weeks, they will simply place the player on IR. So many times a player finishes a season "injured", they could have actually returned to play by the end of the season had they not been placed on IR. This is especially common for backup caliber players.
Another area where the rules dictate injury length comes in the out of place 8 times a player returned following a 7 game injury, despite the fact that a return after a 6 game absence occurred just twice, and a return after 8 games occurred just once. This is due to the IR-Designated to Return exemption. Players placed on that list are only able to return after missing at least 8 weeks. This will typically include 7 games plus a bye because the byes are concentrated in the middle of the schedule. Therefore, many players who would otherwise miss 4-6 games, or be placed on IR and miss the rest of the season, get clumped together at 7 games missed.
| Recent Articles |
|---|
| If 2021 Had 16 Games - 1/10/22 |
| Wk 18 Playoff Scenarios 2021 - 1/8/22 |
| Wk 17 Playoff Scenarios 2020 - 1/1/21 |
| Wk 17 Playoff Scenarios 2019 - 12/27/19 |
| 2 Week Playoff Scenarios 2019 - 12/21/19 |
| 3 Week Playoff Tiebreakers 2019 - 12/11/19 |
| NFL Injury Point Value - 6/18/19 |
| How Teams Value Draft Picks - 4/25/19 |
| Analyzing The Zion Injury - 3/21/19 |
| Week 17 Playoff Scenarios 2018 - 12/27/18 |
| BUF | MIA | NE | NYJ | BAL | CIN | CLE | PIT | HOU | IND | JAC | TEN | DEN | KC | LV | LAC | |||||||||||||
| DAL | NYG | PHI | WAS | CHI | DET | GB | MIN | ATL | CAR | NO | TB | ARI | LAR | SF | SEA | |||||||||||||
| ProFootballLogic.com welcomes questions, requests, and error reports by email to contact@profootballlogic.com | ||||||||||||||||||||||||||||
| Privacy Policy | ||||||||||||||||||||||||||||
| Copyright © 2026 ProFootballLogic.com. All Rights Reserved. | ||||||||||||||||||||||||||||