|
|
||||||||||
| ARTICLES | TEAMS | STATS | RATINGS | STANDINGS | GAMES | SCHEDULE | PLAYERS | METHOD | SPORTS | |
How Teams Value Draft Picks
By Michael Gertz
Thursday, April 25, 2019
Last year we analyzed NFL Draft Pick Value by modeling how impactful drafted players turned out to be, based on our Player Ratings. We arrived at an answer that 1st round picks are not even more valuable than 2nd and 3rd round picks in general, due to an increased salary that matched their increased performance. While this strongly disagreed with the way NFL teams value draft picks, we actually ended up with a player performance model that was similar to what other analysts and academic studies had found.
This year we will estimate exactly how teams themselves appear to be valuing the draft picks. Then, using our same conversion factors as in the prior article, we can convert those relative draft pick values into an implied monetary value for each pick, and then the associated production value expected from a player based on that pick value.
How Teams Value Picks
One great thing about the NFL Draft is that we can get a very good sense of how teams value their picks overall, because they trade them so often. To do so, we analyzed all 216 draft pick trades that didn't include any players in the 8 drafts since 2011 when the current rookie salary structure came into effect. First, we also excluded those that included picks in future years beyond the upcoming draft to get a baseline model for how the picks in the current draft are valued.
Doing so was a bit more tricky than expected, as most usual trendline equation formats seem to overfit or underfit the data, or have trouble with the very top of the draft where a few data points are all there is. The solution we settled on was optimizing the values by hand such that the total difference in value between the 2 teams in every trade was minimized. However, to keep the curve smooth, we added the constraints that every draft pick must be worth less than that before it, that the amount it is less must also get smaller with each pick, and even that that amount itself must diminish with each pick. For those who took calculus, that means that the pick values as well as their 1st and 2nd derivatives, or rates of change, must diminish with each pick.
Once this was done for the all trades only involving the upcoming draft, we then repeated the process while including trades that included draft picks in future years, with those picks having a separate curve since they are valued less by teams. For these picks, we decided to define each pick only by its round rather than the individual pick number, as that would be unknown to the teams at the time of the trade (and was largely variable in the small amount of picks near the top of the draft). While we could have modeled more specific expectations of the pick numbers based on team strength, we decided to keep things simpler since there were only 46 trades involving future picks anyway.
The result was that teams for the most part appear to simply discount future picks by 1 round compared to current year picks, which is a very steep discount resulting in most picks only being worth around 50% as much simply because they are a year in the future. The other strange part of this method of discounting is that it doesn't result in an even discount percentage, as future 1st round picks are valued below 40%, while later rounds are all around 50%, implying future 1st round picks can be acquired at a huge discount.
While there were only 3 trades involving picks from drafts 2 years in the future, so the data is unreliable, the other odd aspect is that these picks don't appear to have been given much further discount beyond the picks that were 1 year in the future. Both this fact, and the '1 round discount' finding rather than a standard percentage discount, would imply that teams simply haven't even bothered to model these things and when they trade future picks they are simply going off of their gut instincts.
Below is a graph showing the relative draft pick values we estimated, shown in the blue dots. The green dots, with only 1 in the middle of each round, show the value given to draft picks in the following year's draft. The values are all simply relative to one another, so the scale of the y-axis is irrelevant.
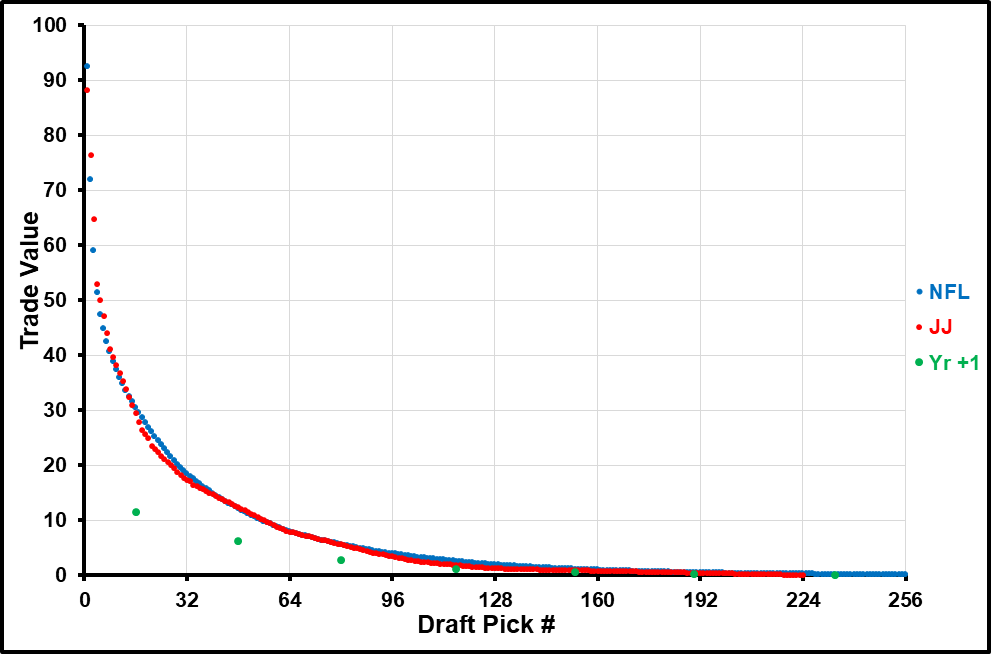
The red dots represent the often referenced draft value chart from Cowboys coach Jimmy Johnson in the 1990s. The fact that they so closely align with the current values teams use, despite rookie salaries changing repeatedly for 20+ years, is yet another sign that teams haven't actually tried to do the analysis that we are doing, instead basically just following whatever was done in the past.
One crazy thing is that not only do most teams do that, every single one does it. While the Patriots perhaps think outside the box the most as they developed a bit of a reputation from trading down, even they only did it a few times. If any team seriously analyzed the draft and came to a conclusion even remotely different from the general trend, they should be trading into certain rounds more than others every single year.
The one bit of individual thought in the draft appears to be in the form of trading for the future picks, which we found to be undervalued above. While most teams trade for or trade away future picks about equally, 3 teams appear to be wisely trading for them as an actual strategy. The 49ers, Browns, and Patriots have traded for future round picks in trades that didn't include players respectively 9, 8, and 6 times more than they've traded them away in the past 8 years. The Saints appear most willing to give away these valuable future picks, having done so a net 5 times. All other teams are between a net -3 to +3 in that category.
Comparing To Our Analysis
Now that we know how teams value picks, we can compare it to how our previous analysis valued the picks. Our previous analysis converted player production into an equivalent salary that each player would be worth. It then subtracted the rookie salary each pick gets from that figure in order to find the net surplus value of each pick.
For instance, if the 32nd overall pick on average is worth about $3.2M per year in production, but he only gets a salary of about $2.2M per year, then his surplus value is about $1M per year, or about $4M over the life of his 4 year rookie contract.
Figuring out how teams value draft picks in terms of their monetary value would take a complex analysis of player trades, and even then would require assumptions about how much value the teams thought each player's production was worth relative to their salary. The most interesting data point of which could be when the Browns essentially received about a 2nd round pick in order to take on about $10M in cap space for Brock Osweiler, which was the only time an NFL player had actually been traded as a salary dump.
On top of this, teams themselves probably don't even think of player trades in monetary figures as they should, based on their lack of analysis we described above. So rather than go through that complex analysis that would still be rather rough, we decided to simply take a rough educated guess. In the graph below, we compared our calculated monetary values for each draft pick to a potential fit that the teams follow.
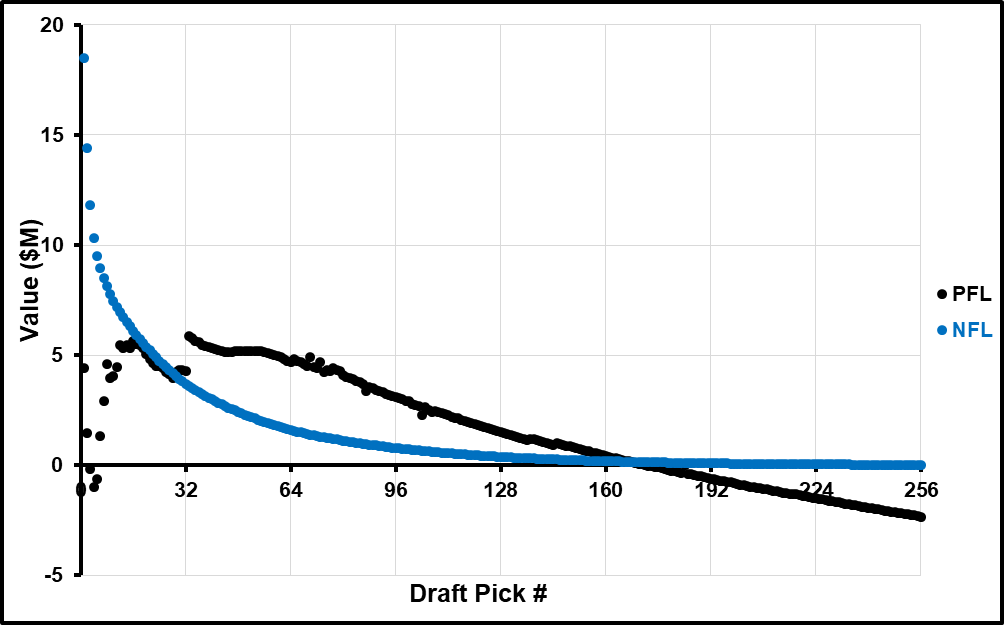
While it would be great to nail down a more accurate scaling of how teams value picks monetarily (the blue dots), the important thing here is simply the shape and relative values that teams use. The scale that we use here (about an $18.5M figure for the #1 overall pick) could easily be way off, and we suspect if anything it may be lower than it should be.
But the main point is that if it is off, the correction would be a simple factor of multiplying the entire curve by the same number, moving the whole thing up or down a certain percentage, because we know very clearly that teams do stick to the overall shape of the curve.
Essentially, anywhere our black dots are above the teams' blue dots is an area of the draft that we would recommend a team trade into, and anywhere the blue dots are higher is an area we would recommend teams trade out of. As expected, our model recommends trading down from the 1st round, with potentially the most value to be found around the 3rd round. It potentially also recommends trading up from the final rounds, although our player production fit may be more unreliable there.
As seen in the graph, these findings appear to be the case almost regardless of a large shift in the team curve. For instance, even if we underrated how teams value all the picks by a factor of 2, the team curve would still fall below our curve in the 3rd and 4th rounds, but in this case it would be even more important to avoid drafting in the 1st round, especially near the top of the draft. Although, as mentioned in our previous article, this only applies to non-QB picks, as we found that QBs are the only position that on average creates enough production to justify a high value being assigned to very high picks.
An interesting point to mention is that we can imagine 2 extreme cases of scaling, such that one entire curve was above the other. For instance, if it turned out the correct scaling of the blue dots was to multiply them by around 3 or more, we would encounter a scenario where our model would suggest trading away just about all your draft picks for veterans instead. On the flip side, if the correct scaling were dividing all the blue dots by about 2 or more, it would approach a scenario where picks were so valuable that constantly trading away players for picks would be optimal. As it stands, our model would recommend often trading away players, but only if it was either for 3rd or 4th round picks, or the picks acquired were then traded for 3rd or 4th round picks.
Converting To Player Production
While our original article started with measuring player production, and converted it all the way to draft pick value, we have to use the reverse process to analyze how teams value picks. The final step here is converting the estimated teams' monetary figures from the graph above into a value of on-field player production. This figure is essentially how much salary the player should be worth per year if he was a free agent.
Based on the scale we chose above, we can then graph an estimated player production level that teams go by, whether they realize it or not. This produces the graph below, where the blue dots are simply the values from the blue dots above, divided by 4 to convert to a per year basis rather than a total over the life of the contract, and then adding that to the player salary associated with each pick.
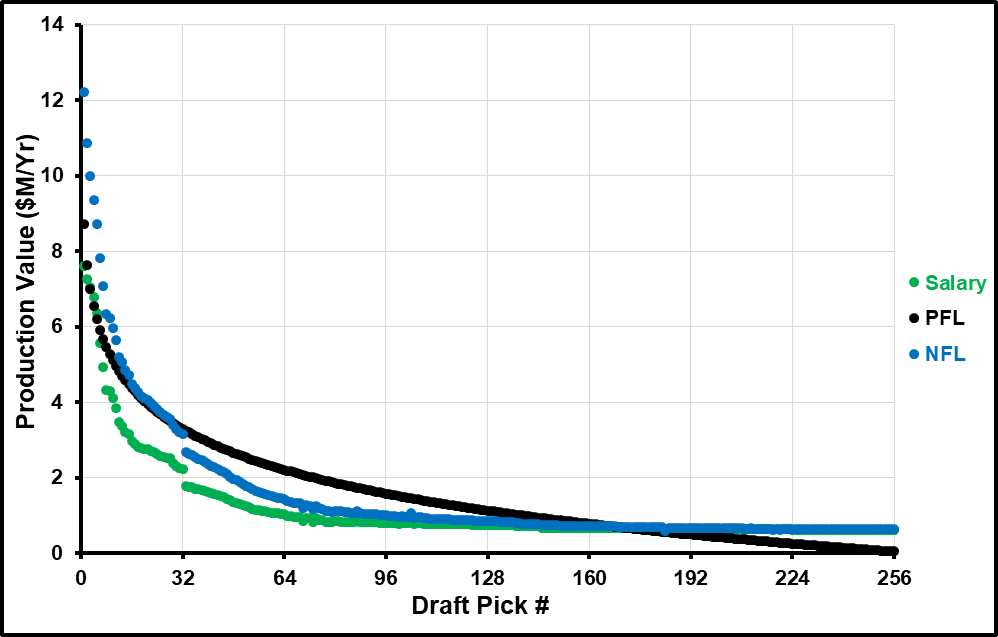
For instance, the 64th overall pick had a surplus value of about $1.6M, or about $0.4M per year. Since that player gets a salary (the green dots) of about $1M per year (these figures are all from 2017 so they could all be inflated equally), that means teams are estimating him to actually produce at a level of a player worth a salary of $1.4M per year on the free market. So the blue dot for the 64th pick lands around $1.4M on this final graph.
The other dots on the graph are our values (as opposed to the teams') for how much the player would be worth on the free market, in black. Here we can see that overall the valuations about how much the players are ultimately worth in salary doesn't vary too much between our model and how teams value them, yet that small difference can still create huge differences for how much each draft pick is worth.
For instance, we value the #10 pick as on average a player worth an annual salary of $5.1M, while the curve we estimated for teams puts him at $6.0M. Despite that difference being pretty minor and potentially within the errors of either estimate, because the salary at the #10 pick is $4.1M, that still results in the difference between the value of the player and his salary being about twice as much according to teams as according to our model.
These differences get amplified even more for many picks near the very top of the draft. For instance, we assign the #4 pick basically no value because our model shows that player being worth about $6.5M per year, but also getting a salary of $6.8M. Meanwhile teams value that player around $9.4M per year, giving the pick a value of $2.6M per year for a total value of $10.4M.
Using this final graph, we can get further insight into how we should have scaled the previous graph. For instance, imagine a player on the final year of a contract, who will earn $2M this year, but whose market value is more like $8M per year. That player's trade value should be $6M. In the scaling we chose, that would make him worth about an average 1st round pick. However, such a player seems to usually be traded for a 2nd or even 3rd round pick.
That would indicate we should increase the scale. However, once we start comparing players to the last graph, scaling up starts to seem ridiculous. For instance, the scale we chose puts teams valuing the #5 pick as a player worth about an $8.7M per year market value. But that figure already seems high. Say a DT is taken 5th, that would mean he's already valued as the 15th or so best DT in the NFL.
Now imagine we double the scaling, to where a 2nd round pick is still only worth about $5M total. Then that same DT jumps in quality to an $11.1M per year market value. Now he practically has to make the Pro Bowl every year, which is not typical for an average #5 pick. The same scaling would jump the #1 pick all the way up to the quality of a $16.9M per year market value. That's like expecting him to be one the best couple players at his position, which is way too high an expectation. That's compared to an already high $12.2M figure even at the current scaling.
A final piece of evidence that almost regardless of the scaling we choose, the overall shape of the curve teams use is too steep, comes from our original draft analysis of Draft Position and Player Quality from back in 2013. In it, we calculated the odds that a player of any draft pick would end up a better player than another at a different pick.
We found, for instance, that the 1st overall pick only had a 75% chance of being better than the 1st pick of the 2nd round. But even with our rather conservative scaling, teams value the 1st pick as a $12.2M per year quality compared to the 33rd pick as $2.7M per year. Essentially, they are valuing the #1 pick's production as worth 4.5 times that of the #33 pick, despite only having a 75% chance of even being the better player at all.
What To Root For Your Team To Do
Now that we have trade values assigned to each pick, we can play out a scenario we imagined in our previous article. What if a team followed our model, and it turned out our model was correct, then how much value could be gained each draft?
Taking an average team drafting in the middle of each round, their 1st round pick alone could be converted into at least 5 3rd round picks, which in our model would be a net benefit of $14M. Further gains could be made by trading into the 4th round, but doing so would result in so much roster turnover each year it would be untenable. Teams could also trade for future picks for larger gains.
Ultimately, an annual $14M added to the salary cap each year wouldn't be a game changer, but it would be like having an additional Pro Bowl caliber player on the roster. Of course, our model may somewhat overestimate the benefit of such a strategy, so the real life gains could be a bit more modest. However, it's still hard to picture a scenario where our model is so far off that teams shouldn't have trading down as a particular point of emphasis.
| Recent Articles |
|---|
| If 2021 Had 16 Games - 1/10/22 |
| Wk 18 Playoff Scenarios 2021 - 1/8/22 |
| Wk 17 Playoff Scenarios 2020 - 1/1/21 |
| Wk 17 Playoff Scenarios 2019 - 12/27/19 |
| 2 Week Playoff Scenarios 2019 - 12/21/19 |
| 3 Week Playoff Tiebreakers 2019 - 12/11/19 |
| NFL Injury Point Value - 6/18/19 |
| How Teams Value Draft Picks - 4/25/19 |
| Analyzing The Zion Injury - 3/21/19 |
| Week 17 Playoff Scenarios 2018 - 12/27/18 |
| BUF | MIA | NE | NYJ | BAL | CIN | CLE | PIT | HOU | IND | JAC | TEN | DEN | KC | LV | LAC | |||||||||||||
| DAL | NYG | PHI | WAS | CHI | DET | GB | MIN | ATL | CAR | NO | TB | ARI | LAR | SF | SEA | |||||||||||||
| ProFootballLogic.com welcomes questions, requests, and error reports by email to contact@profootballlogic.com | ||||||||||||||||||||||||||||
| Privacy Policy | ||||||||||||||||||||||||||||
| Copyright © 2026 ProFootballLogic.com. All Rights Reserved. | ||||||||||||||||||||||||||||