|
|
||||||||||
| ARTICLES | TEAMS | STATS | RATINGS | STANDINGS | GAMES | SCHEDULE | PLAYERS | METHOD | SPORTS | |
World Cup Odds Visualization
By Michael Gertz
Wednesday, June 11, 2014
Below is a visualization of the advancement odds of every team in the 2014 World Cup. It is based on data that can be found in table form in our Soccer page. There, the table can be sorted and shows the minor differences between teams, but the visualization below offers the big picture perspective that the table can't.
From left to right, the visualization represents the stages of the tournament. Every team starts out equal on the left, and their odds change at each of 5 points going to the right, representing their odds of advancing through each stage of the tournament. The first change represents odds of getting out of the group stage, with each subsequent change representing odds to go 1 round further in the knockout rounds. The height of a team's colored area at each stage represents their odds of getting to that stage, but is always divided by the total number of teams left at the stage. A theoretical team that had a 100% chance of winning every game would double its size at each stage, while a team that had a 50% chance of winning every game would keep the same size at every stage.
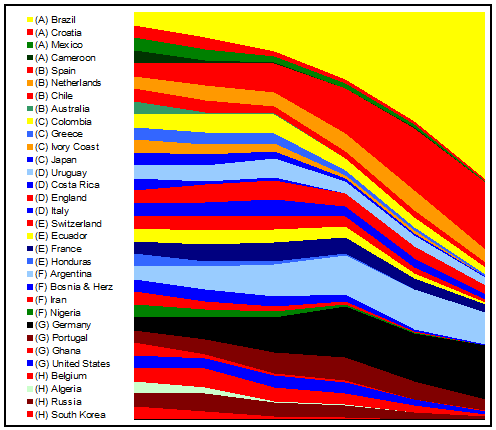
There are some subtle constraints on the graph that are a product of the format of the tournament. In a standard bracket tournament like the NCAA basketball tournament, the constraints are simple. We know that only 1 team can emerge from each local group of 2 in the 1st round, group of 4 in the 2nd round, and so on, so each of those groups must have an equal total height. For instance, in terms of making it to the championship, the top half of the bracket has to be equal in size to the bottom half, because we know only 1 team from each half of the bracket can make the final. Where those constraints occur, we see exactly flat borders between 2 teams.
In the World Cup, the group stage complicates things a bit, but some contraints remain. After the first stage, each group still must have an equal total height becuase exactly 2 teams advance from each group. This can be seen for instance by the flat line between Group G and Group H at the beginning.
After that, the winner of Group A will face the 2nd place team from Group B, and the winner of Group B will face the 2nd place team from Group A on the opposite half of the bracket. Despite being on opposite halves of the bracket, we still know that exactly 2 teams total from Group A and Group B will advance to the quarterfinals. The same goes for the pairings of Group C and D, E and F, and G and H, such that each of the 4 sets of 2 groups will produce 2 teams each of the final 8. This can be seen for instance by the flat line between Group F and Group G that is 2 stages wide.
In the quarterfinals, the 2 teams remaining from Group A and B face those 2 remaining from C and D, and so on. At this point, Groups A, B, C, and D together must advance exactly 2 teams to the semifinals while Groups E, F, G, and H do the same. This forms the flat line between Group D and Group E that is 3 stages wide. That is the final constraint, as the final match could be between any 2 of the 32 teams depending on who finished 1st or 2nd in their group.
Using these constraints as guidelines, we can see some general patterns of strength in the graph. For instance, when teams from Group G and Group H face off in the Round of 16, Group G is much more likely to see its teams advance to the quarterfinals. And there is a good chance that the 2 remaining teams from Groups A and B will dominate the 2 from Groups C and D in the quarterfinals. Further, also due to the strength of Brazil and Spain, Groups A and B are likely to produce as many teams in the final as the other 6 groups combined.
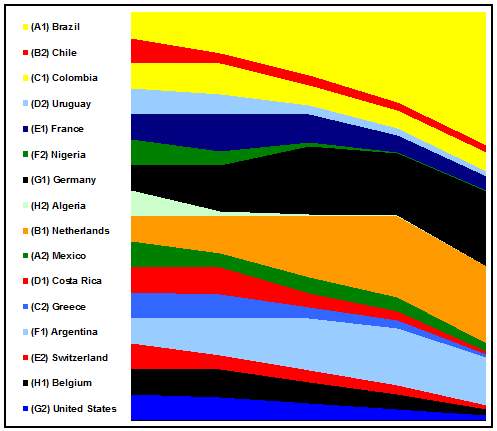
Knockout Rounds Update (6/27/14)
Below is a June 27th update to the advancement odds visualization, representing the remaining 16 teams' odds as they stand after the group stage but prior to the knockout rounds.
| Recent Articles |
|---|
| If 2021 Had 16 Games - 1/10/22 |
| Wk 18 Playoff Scenarios 2021 - 1/8/22 |
| Wk 17 Playoff Scenarios 2020 - 1/1/21 |
| Wk 17 Playoff Scenarios 2019 - 12/27/19 |
| 2 Week Playoff Scenarios 2019 - 12/21/19 |
| 3 Week Playoff Tiebreakers 2019 - 12/11/19 |
| NFL Injury Point Value - 6/18/19 |
| How Teams Value Draft Picks - 4/25/19 |
| Analyzing The Zion Injury - 3/21/19 |
| Week 17 Playoff Scenarios 2018 - 12/27/18 |
| BUF | MIA | NE | NYJ | BAL | CIN | CLE | PIT | HOU | IND | JAC | TEN | DEN | KC | LV | LAC | |||||||||||||
| DAL | NYG | PHI | WAS | CHI | DET | GB | MIN | ATL | CAR | NO | TB | ARI | LAR | SF | SEA | |||||||||||||
| ProFootballLogic.com welcomes questions, requests, and error reports by email to contact@profootballlogic.com | ||||||||||||||||||||||||||||
| Privacy Policy | ||||||||||||||||||||||||||||
| Copyright © 2026 ProFootballLogic.com. All Rights Reserved. | ||||||||||||||||||||||||||||