|
|
||||||||||
| ARTICLES | TEAMS | STATS | RATINGS | STANDINGS | GAMES | SCHEDULE | PLAYERS | METHOD | SPORTS | |
NCAA Bracket Visualization
By Michael Gertz
Tuesday, March 18, 2014
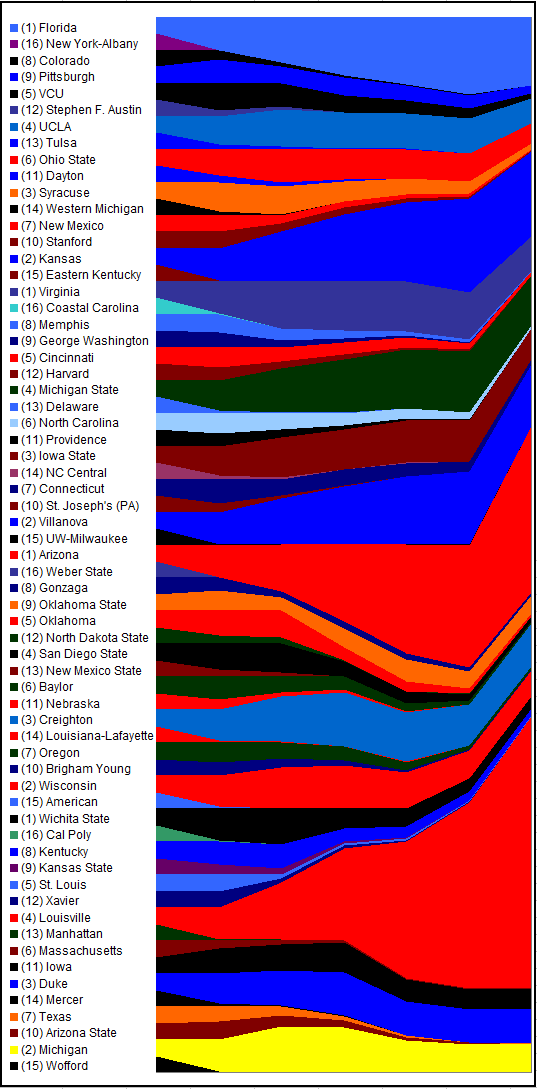
Below is a visualization of the advancement odds for every team in the NCAA Tournament. It is based on data that can be found in table form in our College Basketball Ratings page. There, the table can be sorted to compare minor differences between teams to pick a good bracket, but the visualization below gives the big picture perspective that the table doesn't.
From left to right, the visualization represents the stages of the tournament. Every team starts out equal on the left, and their odds change at each of 6 points going to the right, representing their odds of advancing through each stage of the tournament. The height of a team's colored area at each stage represents their odds of getting to that stage, but is always divided by the total number of teams left at the stage. A theoretical team that had a 100% chance of winning every game would double its size at each stage, while a team that had a 50% chance of winning every game would keep the same size at every stage.
| Recent Articles |
|---|
| If 2021 Had 16 Games - 1/10/22 |
| Wk 18 Playoff Scenarios 2021 - 1/8/22 |
| Wk 17 Playoff Scenarios 2020 - 1/1/21 |
| Wk 17 Playoff Scenarios 2019 - 12/27/19 |
| 2 Week Playoff Scenarios 2019 - 12/21/19 |
| 3 Week Playoff Tiebreakers 2019 - 12/11/19 |
| NFL Injury Point Value - 6/18/19 |
| How Teams Value Draft Picks - 4/25/19 |
| Analyzing The Zion Injury - 3/21/19 |
| Week 17 Playoff Scenarios 2018 - 12/27/18 |
| BUF | MIA | NE | NYJ | BAL | CIN | CLE | PIT | HOU | IND | JAC | TEN | DEN | KC | LV | LAC | |||||||||||||
| DAL | NYG | PHI | WAS | CHI | DET | GB | MIN | ATL | CAR | NO | TB | ARI | LAR | SF | SEA | |||||||||||||
| ProFootballLogic.com welcomes questions, requests, and error reports by email to contact@profootballlogic.com | ||||||||||||||||||||||||||||
| Privacy Policy | ||||||||||||||||||||||||||||
| Copyright © 2026 ProFootballLogic.com. All Rights Reserved. | ||||||||||||||||||||||||||||