|
|
||||||||||
| ARTICLES | TEAMS | STATS | RATINGS | STANDINGS | GAMES | SCHEDULE | PLAYERS | METHOD | SPORTS | |
2015 NCAA Basketball Model
By Michael Gertz
Saturday, March 14, 2015
The model behind our College Basketball Ratings has been updated for the 2015 NCAA Tournament. The main process of optimizing for the most likely team ratings using game scores remains the same, but some minor additions have been made to improve overall accuracy.
The Old Model
In both the old and new models, the likelihood of any game result is calculated based on a normal probability distribution which uses each team's rating and the location of the game. Because the odds of 2 game results both happening is the product of the odds of each game result, the odds of the entire set of NCAA D-1 college basketball game results for a season happening is calculated by multiplying together the probability of each game's result occurring. Knowing the probability of any 1 specific season of outcomes for any set of team ratings, we can then run an optimization to find the distinct set of team ratings that gives the highest probability for the overall season of results that actually occurred.
While the old model produced very accurate team ratings and bracket projections that out performed most any media "experts", it had a minor flaw that left a little room for improvement. Any statistical model must actually make a starting assumption. The old model made the starting assumption that all possible team ratings are equally likely for any team. While that assumption seems the most fair (and could logically be used by the NCAA Tournament selection committee for that reason), it isn't quite best at simply accomplishing the goal of the most accurate ratings possible.
While any initial assumptions are ultimately going to be overwhelmed in the model by the vast data of a whole season's results, they can still play a small role, so it's worthwhile to make them as accurate as possible. And the fair assumption has 2 minor issues. The first is that it is not team specific, and ignores the fact that we come into the season knowing something about each team based on their previous seasons. And second, it assumes a constant flat probability distribution rather than a normal (bell-curve) distribution that we should expect to find.
The 2015 Model
To make the initial assumptions more accurate, we examined how a team's rating typically changes from one year to the next. The graph below, using our 2012-2014 ratings, shows that on average a team's rating will be about 0.85 times as far from average as it was the previous year. A team's rating is the expected point differential in a game between them and an average team at a neutral site.
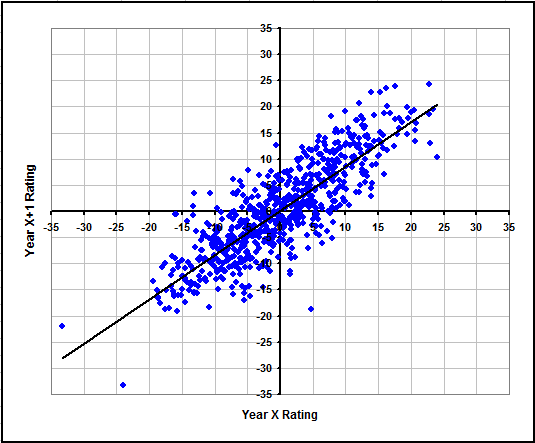
The fact that the figure comes out to about 0.85 rather than 1.00 represents a small amount of regression to the mean, meaning that the following year teams on average are slightly more average compared to the prior year. Due to a relatively constant perception of which schools recruits should choose, and the large number of teams, college basketball actually has much less regression to the mean than most sports. This means the good teams generally stay good and the bad teams generally stay bad. We have previously estimated that college football and NFL team ratings will respectively be about 0.74 and 0.50 times as far from average as they were the previous season.
However, the factor of 0.85 does not hold up for each team every year. A team's rating 2 years later is still on average 0.78 times its original rating, significantly higher than the 0.72 multiple we would find if regression was even across the board for all teams. This shows that we can gain accuracy by digging even deeper and also factoring in a team's rating from 2 years ago.
Using a multivariate regression analysis, we find that the best estimate for a team's rating is actually about 0.73 times its previous year's rating plus 0.18 times its rating from 2 years ago. We don't yet have data to analyze how a team's rating from 3 seasons ago may also contribute. It would probably add some value, but be too small to have real significance.
This analysis not only gives us a preseason best guess as to what a team's rating will be, but also tells us the odds that the rating will be a certain distance from our projection. The result is an initial assumption that a team's rating will be modeled by a normal probability distribution centered around the team's projected rating, with a standard deviation of about 4.5 points.
Using that distribution, we can assign an initial probability that each team would have any given rating. Then when team ratings are optimized, those probabilities are also multiplied in with the game probabilities to form the overall probability of a season's results, like a sort of prior of Bayesian inference.
In this way, the preseason projection naturally has a large impact early in the season but a smaller impact once more games are played. By the NCAA Tournament, the different preseason estimate probably only accounts for a couple points or less difference for most teams, but that difference should usually be in the right direction and add to overall accuracy.
| Recent Articles |
|---|
| If 2021 Had 16 Games - 1/10/22 |
| Wk 18 Playoff Scenarios 2021 - 1/8/22 |
| Wk 17 Playoff Scenarios 2020 - 1/1/21 |
| Wk 17 Playoff Scenarios 2019 - 12/27/19 |
| 2 Week Playoff Scenarios 2019 - 12/21/19 |
| 3 Week Playoff Tiebreakers 2019 - 12/11/19 |
| NFL Injury Point Value - 6/18/19 |
| How Teams Value Draft Picks - 4/25/19 |
| Analyzing The Zion Injury - 3/21/19 |
| Week 17 Playoff Scenarios 2018 - 12/27/18 |
| BUF | MIA | NE | NYJ | BAL | CIN | CLE | PIT | HOU | IND | JAC | TEN | DEN | KC | LV | LAC | |||||||||||||
| DAL | NYG | PHI | WAS | CHI | DET | GB | MIN | ATL | CAR | NO | TB | ARI | LAR | SF | SEA | |||||||||||||
| ProFootballLogic.com welcomes questions, requests, and error reports by email to contact@profootballlogic.com | ||||||||||||||||||||||||||||
| Privacy Policy | ||||||||||||||||||||||||||||
| Copyright © 2026 ProFootballLogic.com. All Rights Reserved. | ||||||||||||||||||||||||||||